
Uptake and completion of tuberculosis preventive therapy among people living with HIV on antiretroviral therapy in Uganda, 2020–2023
Authors: Innocent Ssemanda¹*, Susan Waako1, Benon Kwesiga¹, Mina Nakawuka2, Institutional affiliations: ¹Uganda Public Health Fellowship Program, Uganda National Institute of Public Health, Kampala, Uganda, 2AIDS Control Program, Ministry of Health, Kampala, Uganda; Correspondence*: Tel: +256777531618, Email: issemanda@uniph.go.ug
Summary
Background: In 2015, Uganda adopted the World Health Organization (WHO) guidelines for Tuberculosis (TB) prevention among PLHIV. Accordingly, the country has implemented several initiatives to scale up TB preventive therapy including the integration of TB Preventive Therapy (TPT) into HIV care services. The WHO target for both initiation and completion among PLHIV in care is 90%. We described the trends and spatial distribution of TPT uptake and completion, and reasons for non-completion among PLHIV, Uganda, 2020-2023 to track progress towards meeting the targets.
Methods: We extracted and analyzed national and subnational aggregated data on TPT among PLHIV on ART as reported through DHIS2 from January 2020 to December 2023. We calculated rates of TPT eligibility, initiation, and completion. Reasons for failure to complete TPT were categorized as a loss to follow-up, TB diagnosis, and death while on TPT. We analyzed trends using Mann Kendall test and described spatial distribution by region.
Results: By June 2023, a cumulative total of 1,330,693 antiretroviral therapy (ART) clients had been eligible for TPT of which, 1,157,703 (87%) had been initiated on TPT and 92% completed their treatment. Both uptake and completion rates significantly increased from 2020 to 2023 at 87% and 96%, respectively. Of the 79,106 ART clients who did not complete their TPT regimen, 29,435 (37%) were lost to follow-up, 2,356 (3%) died, and 1,589 (2%) were diagnosed with TB while on TPT.
Conclusion: Uganda achieved high levels of TPT uptake and high completion rates among PLHIV considering the WHO targets. The Ministry of Health should however explore factors associated with TPT loss to follow-up in this subpopulation for better program performance.
Background
Tuberculosis (TB) remains the leading cause of illness and death among people living with HIV (PLHIV) globally [1]. People living with HIV are at high risk of developing active TB due to their weakened immune response and equal risk of exposure to TB infection in their communities just as the HIV-negative population [2, 3]. In 2022, 0.89 million TB cases were attributed to HIV, and 167,000 TB deaths were among HIV-positive people [4, 5]. Tuberculosis remains the world’s leading infectious disease killer in low- and middle-income countries [4].
The World Health Organization’s End TB strategy calls for a reduction in TB cases and TB deaths by 90% and 95% respectively, by 2035 [6].
The organization has a goal of eliminating TB as a public health problem by 2050 and one of its main strategies is TB preventive treatment (TPT), which is the administration of anti-TB drugs to people who do not have symptoms or signs of active TB disease (regardless of their tuberculin skin test or interferon-gamma release assay status) [1, 7, 8]. This is an effective intervention to reduce the incidence and mortality of TB among PLHIV [7]. It has been reported to reduce the risk of developing active TB disease by up to 60% and the risk of dying from TB by up to 37% among PLHIV[8]. The World Health Organization (WHO) recommends TPT for all PLHIV as part of a comprehensive package of HIV care, along with antiretroviral therapy (ART), cotrimoxazole prophylaxis, and regular screening for TB symptoms [9]. The WHO End TB Strategy calls for 90% TPT coverage among PLHIV and close contacts of infectious TB patients by 2035 [10, 11].
Uganda adopted the WHO recommendations and guidelines for TPT and has implemented several initiatives to scale up TPT among PLHIV since 2015 [12]. These include integrating TPT into HIV care services, introducing new TPT regimens such as rifapentine-based 3HP, conducting mass campaigns to increase awareness and demand for TPT, and using digital technologies to monitor and support TPT adherence and completion [13, 14]. As a result, the country has achieved remarkable progress in increasing TPT coverage among PLHIV from 0.6% in 2016 to 88.8% in 2022 [15]. However, data on the trends and distribution of TPT uptake and completion among PLHIV in Uganda at the national and sub-national levels remains suboptimal. To inform programming, we described the TPT cascade, assessed the trends of TPT uptake, completion, and the temporal distribution of loss to follow-up among PLHIV on ART in Uganda,2020-2023
Methods
We conducted a descriptive analysis study using TPT surveillance data from all the health facilities across the country that report through the District Health Information System version 2 (DHIS2). DHIS2 is a web-based platform that collects routine health service data from all public and private health facilities in Uganda, including information on HIV testing, care, and treatment services, as well as TB screening, diagnosis, treatment, and prevention [16]. Health facilities report this data to the district health offices through the HMIS report 106a, which is then aggregated and submitted to the Ministry of Health. Uganda’s health facilities are classified into seven levels based on the services they provide and the catchment area they are intended [17]. The classification starts at a Health center II up to the National Referral Hospital. Of the seven, TB and HIV care is provided at six levels, starting from Health center III. Therefore, the data included in this study came from these facilities.
The study population included all records for PLHIV who were enrolled in HIV care services and eligible for TPT according to the national guidelines [18]. We collected data on TPT uptake rates, completion, and loss to follow-up rates. As per the guidelines, TPT uptake was defined as starting any TPT regimen whereas completion was defined as receiving a full course of the prescribed TPT regimen. Therefore, we calculated TPT uptake rate by dividing the number of eligible ART clients initiated on TPT by the number of all eligible ART clients, and TPT completion rate was calculated by dividing the number of all ART clients on TPT expected to complete and completed in each semi-annual period by the number of ART clients on TPT expected to complete, and loss to follow-up rate was defined as the number of ART clients expected to complete in each period but were lost to follow-up divided by the total number of ART clients expected to complete in that period. We also determined the national reporting rates during the study period. For the TPT cascade, we determined the proportion of PLHIV on ART who were eligible for TPT from the total number of PLHIV on ART. From those who were eligible, we determined the proportion of those who had initiated TPT and from those who had initiated; we further determined the proportion of those who completed their TPT regimen.
We used line graphs to determine trends of uptake, completion, and loss to follow-up of TPT clients. Data was exported to STATA for analysis and used the Mann-Kendal test to determine the significance of trends at a level of 0.05.
We used the Quantum Geographic Information System (QGIS) for spatial analysis to visualize and measure the spatial patterns and variations of TPT loss to follow up among PLHIV across regions in Uganda.
We used secondary data from the DHIS2 that are routinely collected and reported by health facilities as part of the national health information system. The data are anonymized and do not contain any personal identifiers of the patients or health workers. The study did pose minimal risk to the privacy or confidentiality of the data subjects. The protocol was approved as non-research by the Centers for Disease Control and Prevention.
Results
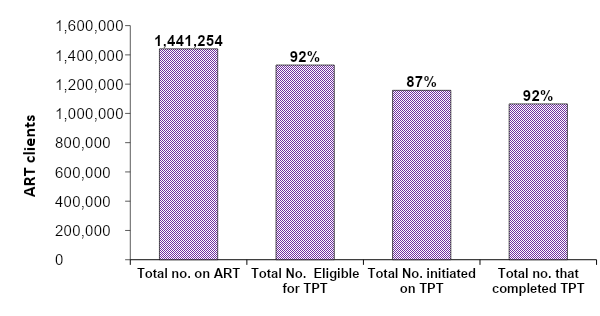
Tuberculosis preventive therapy cascade among HIV patients on ante-retro viral therapy, Uganda, 2020‒2023
A total of 5,316,668 patient DHIS2 entries from January 2020 to December 2023 from over 1,990 facilities, were examined and used for the study. During the study period, we found that by the beginning of 2022, 1,441,254 PLHIV had been enrolled on antiretroviral therapy of which, a cumulative total of 1,330,693 (92%) were eligible for TB preventive therapy (TPT). Of these who were eligible, 87% (1,157,703) were initiated on TPT and 92% (1,065,086) of those who initiated were able to complete their full dose of TPT (Figure 1)
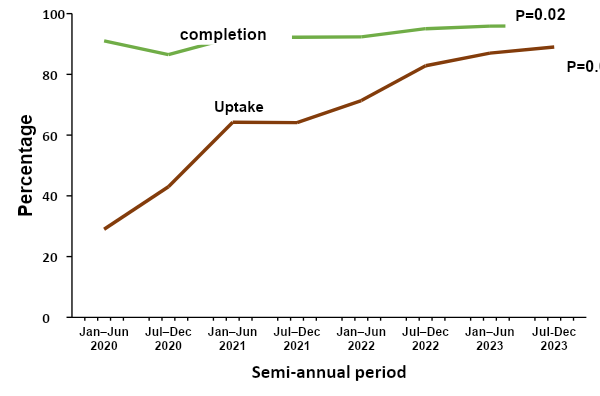
Trends in Tuberculosis preventive therapy uptake and completion among HIV patients on ante-retro viral therapy, Uganda, 2020‒2023
During the study period we found that the average national reporting rate was 93.8. Overall, the rates of uptake and completion of TPT in Uganda increased by 58% and 5% respectively over the 4-year period. We performed a Mann-Kendall test to examine the trend of both uptake and completion rates. The results showed that there was a significant improvement uptake (p=0.004) and completion (p = 0.02) respectively. The greatest increase for both was between July 2020 and June 2021 (Figure 2).
Regional distribution of tuberculosis preventive therapy uptake among HIV patients on ante-retro viral therapy, Uganda, 2020‒2023
Uptake of TPT varied across regions in Uganda, ranging from 68% to 94%. The upper west (Bunyoro), Lower North (Lango), and Northeast (Karamoja) had the highest uptake and Midwest (Tooro) had the lowest uptake (Figure 3).
Figure 3: Regional distribution of tuberculosis preventive therapy uptake among HIV patients on ante-retro viral therapy, Uganda, 2020‒2023
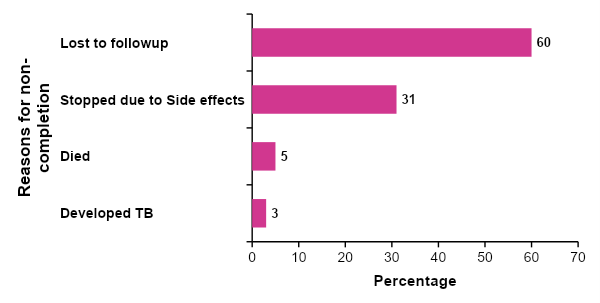
Loss to follow up, death, and discontinuation of tuberculosis preventive therapy among HIV patients on ante-retro viral therapy who did not complete their regimen, Uganda, 2022‒2023
During this study period, a total of 92,617 (8%) ART clients on TPT did not complete their course of TPT. We found that of those who did not complete, one third did not have documented reasons.
However, of those who had documented reasons, majority (60%) were lost to follow-up and 31% stopped due to side effects. Whereas 5% died, and 3% developed TB before completion (Figure 4).
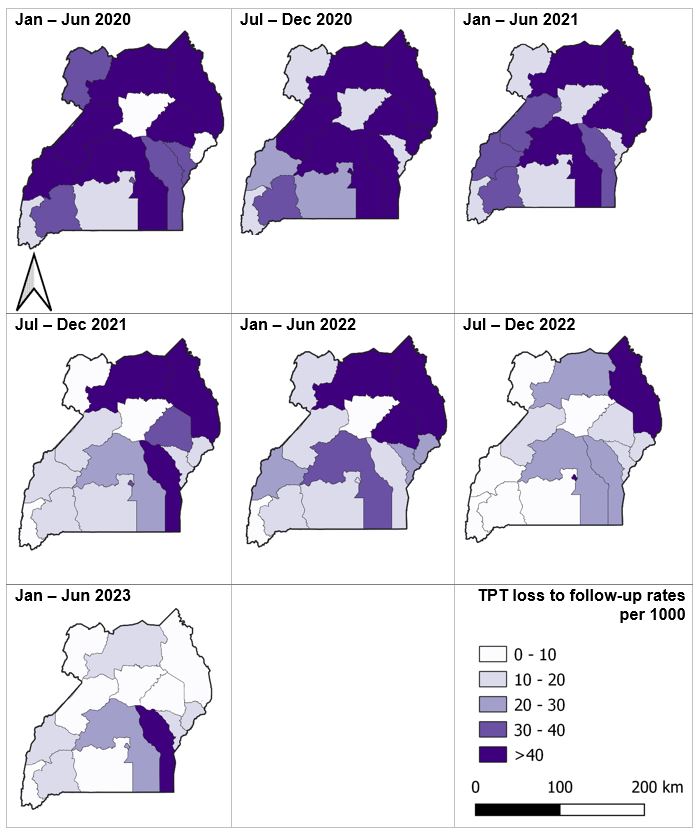
Temporal distribution of loss to follow-up among HIV patients on ante-retro viral therapy who did not complete their tuberculosis preventive therapy regimen by region, Uganda, 2020‒2023
The proportion of regions with a loss to follow-up greater than 40 TPT patients per 1,000 reduced from 53% in period January to June 2020 to 13% by December 2023. Loss to follow-up remained highest in Mid-Eastern sub region (Figure 5).
Discussion
In this study, we describe the trends, spatial and temporal distribution of TPT uptake and completion among PLHIV in Uganda from 2020 to 2023. Tuberculosis Preventive Therapy uptake was at 87% among all eligible patients on ART, and among those who initiated, 92% completed. Considering the targeted 90% for both uptake and completion both indicators improved significantly between 2020 and 2023. Over one-third of persons who did not complete were lost to follow-up, throughout the study period highest in Mideastern region.
Tuberculosis Preventive Therapy completion surpassed the national and global target of 90%. This was consistent with a 2022 study done in Uganda on TPT, which showed a national TPT completion of 94% [15, 19]. This achievement could be attributed to enhanced integration of HIV and TB management among PLHIV by the Ministry of Health made possible by commodity availability, while implementing partners supported TPT demand creation among the beneficiaries [12, 20]. Although TPT uptake improved during the same period, this fell short of the national and global target of 90%. Other studies have suggested that challenges with uptake may be related to clinician’s fears and beliefs and lack of sufficient information on TPT [21]. Additional studies may be needed to understand the causes of low TPT uptake in poorly performing regions.
We did not find significant differences in the proportion of patients lost to follow-up over the three and half years of the study. A 2022 study on factors contributing to TB treatment LTFU in developing countries demonstrated that treatment illiteracy and insufficient pre-treatment counselling were the most important factors associated with LTFU [22]. This study suggested that enhancing pre-screening and pre-treatment counselling could help reduce LTFU. We recommend such a study on specific factors in our setting to inform program implementation.
A 2023 study conducted in Uganda on outcomes of treatment among patients with drug-resistant TB found that a high frequency of adverse events, led to persisting discontinuation of treatment. In our study, 19% of those patients who did not complete treatment was a result of TPT side effects [23]. To address the persistent issue of anti-TB drug side effects, several measures have been proposed elsewhere and one such is nanomedicine, which is an emerging research area that offers the potential of effective drug delivery using nanoparticles and a reduction in drug doses. A study done in 2023 explored the progress of this research and found that this technology offers a slow, sustained, and controlled release of anti-TB drugs and provides advantages of low doses, reduced side-effects and improved patient compliance [24].
Our findings have implications for TB prevention and control programs in Uganda and other similar settings. First, the study demonstrates that initiation and completion of TPT can improve over time, implying that 100% coverage of TPT is feasible. Secondly, for the programs to achieve 100% completion rates, they should address issues leading to loss to follow-up of PLHIV initiated on TPT.
Study limitations
The study has some limitations that should be considered when interpreting the results. First, the study used secondary data from the DHIS2, which may have issues of completeness and accuracy likely leading to either over or under estimation of the study outcomes. Secondly, it was not possible to do age and sex disaggregation’s because this detail missed in DHIS2 our source of data. This may lead to a bias, as vulnerable populations may be underrepresented, or their contributions underestimated.
Conclusion
In conclusion, TPT uptake and completion among PLHIV improved markedly over the three years. However, some PLHIV initiated on treatment discontinue before completion which may affect the impact of TPT among PLHIV in the long term and delay achievement of end TB strategy targets. Although we registered major improvements in completion rates, the number of eligible ART clients initiated on TPT remained lower than the national target. Additionally, Loss to follow-up occurred as a documented reason. However, it is worth noting that loss to follow-up, even when documented, does not provide an actual reason for stopping treatment. It is possible that these patients followed up at another clinic or died or had side effects and chose not to complete. This demonstrates a major challenge with documentation for non-completion. To implement effective interventions, it is necessary to understand the reasons people do not return to the clinic. Our findings add to the available pool of data on TPT implementation among PLHIV in the country to further improve programing towards ending TB in Uganda and similar settings through prevention.
Conflict of interest
The authors declare that they had no conflict of interest.
Authors’ contributions
IS: participated in the conception, design, analysis, interpretation of the study and wrote the draft bulletin; SW, MN, and BK reviewed the report, reviewed the drafts of the bulletin for intellectual content and made multiple edits to the draft bulletin; BK, LB, and ARA reviewed the final bulletin to ensure intellectual content and scientific integrity. All authors read and approved the final bulletin.
Acknowledgments
The authors would like to thank the staff of the Uganda Public Health Fellowship Program for the technical support and guidance offered during this study. They also extend their appreciation to the Ministry of Health and the AIDS Control Program for their permission and support in accessing the data utilized in this project. We would also like to thank the Uganda Centre for disease control and prevention (CDC) for their technical support.
Copyright and licensing
All materials in the Uganda Public Health Bulletin are in the public domain and may be used and reprinted without permission; citation as to source; however, is appreciated. Any article can be reprinted or published. If cited as a reprint, it should be referenced in the original form.
References
- WHO. HIV and Tuberculosis. 2023; Available from: https://www.who.int/westernpacific/health-topics/hiv-aids/hiv-and-tuberculosis.
- Komrower, D. and M. Thillai, Tuberculosis and HIV co-infection. Clinical Tuberculosis: A Practical Handbook, 2015. 157.
- Mebratu, W., et al., Prevalence and associated factors of tuberculosis among isoniazid users and non-users of HIV patients in Dessie, Ethiopia. Scientific Reports, 2022. 12(1): p. 13500.
- USAID. TB/HIV. 2021; Available from: https://www.usaid.gov/global-health/health-areas/tuberculosis/tbhiv.
- WHO. Tuberculosis. 2023; Available from: https://www.who.int/news-room/fact-sheets/detail/tuberculosis.
- WHO. WHO consolidated guidelines on tuberculosis: tuberculosis preventive treatment. 2023; Available from: https://iris.who.int/bitstream/handle/10665/372738/9789240078154-eng.pdf?sequence=1.
- Mbonde, A., et al., A comprehensive analysis of stroke risk factors by HIV serostatus in Uganda: Implications for stroke prevention in sub-Saharan Africa (P1-1.Virtual). Neurology, 2022. 98(18 Supplement): p. 3846.
- Lee, M.C., et al., Isoniazid level and flu‐like symptoms during rifapentine‐based tuberculosis preventive therapy: A population pharmacokinetic analysis. British journal of clinical pharmacology, 2023. 89(2): p. 714-726.
- WHO. Consolidated guidelines on TB preventive therapy. 2020; Available from: https://www.who.int/docs/default-source/campaigns-and-initiatives/world-tb-day-2020/5-faqs-tb-preventive-treatment.pdf?sfvrsn=d633097e_2.
- CDC. Living with HIV – dying of TB. 2023; Available from: https://www.cdc.gov/globalhivtb/who-we-are/features/tbpreventivetherapy.html.
- Den Boon, S., et al., WHO target product profiles for TB preventive treatment. Int J Tuberc Lung Dis, 2022. 26(4): p. 302-309.
- Ministry of Health, U. 2020; Available from: http://library.health.go.ug/sites/default/files/resources/Final%20TB%20Infection%20Control%20Guidelines%202011.pdf.
- Ministry of Health, U. Consolidated-HIV-and-AIDS-Guidelines. 2023; Available from: https://dsduganda.com/wp-content/uploads/2023/05/Consolidated-HIV-and-AIDS-Guidelines-20230516.pdf.
- USAID. Uganda Tuberculosis Roadmap. 2021; Available from: https://www.usaid.gov/sites/default/files/2022-05/Uganda_TBRM21_TB_DIAH_Version_Final.pdf.
- Lukoye, D., et al., Tuberculosis Preventive Therapy among Persons Living with HIV, Uganda, 2016–2022. Emerging Infectious Diseases, 2023. 29(3): p. 609.
- ministry of Health, U.a.C.P.H.L. DHIS2 User Manual, Uganda. 2022.
- Minsitry of Health, U. Health Facility inventory. 2018; Available from: https://health.go.ug/sites/default/files/Signed%20n%20final%20mfl.pdf.
- Ministry of Health, U. Consolidated HIV and AIDS gudilines 2023. 2022; Available from: https://dsduganda.com/wp-content/uploads/2023/05/Consolidated-HIV-and-AIDS-Guidelines-20230516.pdf.
- Musaazi, J., et al., Increased uptake of tuberculosis preventive therapy (TPT) among people living with HIV following the 100-days accelerated campaign: A retrospective review of routinely collected data at six urban public health facilities in Uganda. PloS one, 2023. 18(2): p. e0268935.
- Minsitry of Health, U. 2020; Available from: https://www.health.go.ug/cause/100-day-accelerated-isoniazid-preventive-therapy-scale-up-plan/.
- Baluku, J.B., et al., One dollar incentive improves tuberculosis treatment outcomes in programmatic settings in rural Uganda. Scientific Reports, 2021. 11(1): p. 19346.
- Opperman, M. and I. Du Preez, Factors contributing to pulmonary TB treatment lost to follow-up in developing countries: an overview. African Journal of Infectious Diseases, 2023. 17(1): p. 60-73.
- Kintu, T., et al., Unfavorable treatment outcomes among patients with drug-resistant TB in Uganda. The International Journal of Tuberculosis and Lung Disease, 2023. 27(4): p. 291-297.
- Borah Slater, K., et al., A Current Perspective on the Potential of Nanomedicine for Anti-Tuberculosis Therapy. Tropical Medicine and Infectious Disease, 2023. 8(2): p. 100.
Comments are closed.