
Trends and geospatial distribution of stillbirths in Uganda, 2014-2020
Authors: Petranilla Nakamya1,2*, Allan Komakech1,3, Biribawa Claire1, Stella M. Migamba1,2, Benon Kwesiga1,3, Alex R. Ario1,3___ Institutional Affiliations: 1Uganda Public Health Fellowship Program, Kampala, Uganda 2Public Health Emergency Operation Centre, Ministry of Health, Kampala, Uganda 3Uganda National Institute of Public Health, Kampala, Uganda___ *Corresponding Author: Email: nakamyapetra@musph.ac.ug, Tel: +256 773464431
Summary
Introduction: Uganda is among the countries with the highest burden of stillbirths globally. In 2014, Uganda adopted the World Health Organization (WHO) Every Newborn Action Plan (ENAP), which targets <10 per 1,000 deliveries by 2035. Despite the burden of stillbirths in Uganda, little is known about the trends of burden since ENAP was introduced. We assessed the distribution, temporal, and spatial trends of stillbirths, Uganda, 2014-2020, to guide control interventions. Methods: We obtained and analysed still births surveillance data from the District Health Information System, 2014–2020. A stillbirth was defined as death of a foetus >28 weeks of pregnancy or weighing >1000g before or during birth reported to health facility. We calculated annual incidence rates of stillbirths per 1,000 deliveries at district, regional, and national levels. We used logistic regression to determine significance of trends. Results: The overall national annual incidence of stillbirths decreased from 24/1,000 deliveries in 2014 to 17/1,000 deliveries in 2020. During the same time period, reporting rates declined from 71% in 2014 to 46% in 2020. The central region continuously had the highest incidence rate for the past 5 years despite the largest decline (OR=0.79; CI=0.77-0.83, P<0.001) while the eastern region had the smallest decline (OR=0.59; CI=0.57-0.61, P<0.001). Districts with persistently high annual incidence rates of stillbirths (>30/1000) included Mubende, Kalangala, Hoima, and Nebbi. There was no difference in the reporting rates of the most- vs least-affected districts. Conclusion: Even with suboptimal reporting, the incidence of stillbirths remained far above the national target. Specific areas in the country appear to have particularly high stillbirth rates. We recommend continuous capacity building in managing pregnant women with emphasis on the most affected districts, and investigation into the reasons for low reporting.
Background
Still birth is when a baby dies after 28 weeks of pregnancy, or more than 1000g but before or during birth. Still births are classified into macerated or fresh still births depending on when they occur [1]. Macerated still birth is the intrauterine death of a foetus before the onset of labour where the foetus has showed degenerative changes while fresh stillbirth is the intrauterine death of a foetus during labour or delivery [1]. With quality health care throughout pregnancy and childbirth, most stillbirths are preventable; over 40 percent are fresh still births and can be avoided with improved quality of care during childbirth including routine monitoring and timely access to emergency obstetric care when required [1].
Still births are a growing public health concern. The United Nations Inter-Agency Group for Child Mortality Estimation (UN IGME) released its first-ever global stillbirth estimates in 2020, which revealed that the ratio of the number of stillbirths to number of under-five deaths has increased from 0.77 in 2000 to 0.82 in 2019, globally [2]. The global estimate of still births is 2 million babies yearly, with three out of 4 stillbirths occurring in Sub-Saharan Africa (SSA) or Southern Asia[2]. In SSA, stillbirth rate stands at 21.7 per 1,000 total births. Stillbirths are often underreported, so it is possible that even these numbers are underestimated [1, 3, 4].
In low- and middle-income settings, maternal conditions associated with stillbirth include hypertension, diabetes, maternal infection (e.g. syphilis, malaria, HIV), maternal undernutrition, obesity, and smoking [6].- Other factors which significantly contribute to stillbirths include: foetal asphyxia, trauma, prolonged labour, congenital infections and foetal distress [7, 8].
With quality health care throughout pregnancy and childbirth, most stillbirths are preventable. In Uganda, the rate of stillbirths in 2015 was 21/1,000 live births. Also, a study in a hospital in the North showed the stillbirth rate at 20 deaths per 1000 deliveries [9]. Government of Uganda has ensured that there are health facilities within every 5km radius to help mothers easily access healthcare [10], it has also provided free antenatal care services where mama-kits are distributed to help mother and their unborn babies during delivery [11]. Public health facilities also provide folic acid and iron supplementation, prevention of malaria through providing intermittent preventive treatment and distribution of treated mosquito nets, and improved detection and management of syphilis to pregnant women to improve on pregnancy outcomes [12, 13].
In 2014, the World Health Organisation developed an action plan to prevent stillbirths. This plan, called the Every Newborn Action Plan (ENAP), was adopted by Uganda and targets a reduction in stillbirth rates to <10 per 1000 total births by 2035 [14, 15]. The plan involves supporting government leadership and providing guidance on how to strengthen newborn health components in existing health sector plans and strategies, especially those that relate to reproductive, maternal, and child health. However, there are few data on stillbirth rates in Uganda. Therefore, we assessed the distribution, temporal, and spatial trends of stillbirths in Uganda, 2014-2020, to guide control interventions.
Methods
Study setting
We conducted a countrywide study. Uganda is found in East Africa. The population of the country was approximately 47 million people in 2021 and has a fertility rate of 4.7 births per woman in 2020 [16]. Uganda is divided into health administrative regions which are further subdivided into health sub-districts geographically. The health service delivery is organised in levels from the lowest; Health Centre (HCI), HCII, HCIII, HCIV, general hospital, regional referral hospital, and national referral hospital which is the highest.
Study design and data source
We conducted a descriptive analysis of still-births surveillance data reported through the electronic District Health Information System (DHIS2), a computer-based national health information system. According to the DHIS2, a stillbirth is the death of a foetus weighing >1000g or >28 weeks of pregnancy, either before or during birth. Data on stillbirths is routinely generated at registered health facilities (all public health facilities plus most private health facilities), aggregated at district level, and then forwarded to the national database. This data is then utilized by authorised Ministry of Health officials and other stakeholders for analysis to obtain meaningful information.
Study variables and data analysis
We abstracted data using pivot tables in DHIS2 on still-births as well as total deliveries in the health facilities from January 2014 to December 2020. We obtained data on fresh still births, macerated stillbirths, and total deliveries. The data from DHIS2 was downloaded, merged and summarized in Microsoft Excel sheets.
Data on fresh and macerated stillbirths was summed to obtain the total still births. We calculated incidence rates for still births by country and disaggregated by region, district, and year. We calculated the annual incidence rates by dividing the total number of still-births by the total deliveries in health facilities, multiplied by 1,000 in Uganda between 2014 and 2020. We obtained a mean annual incidence rate by summing the annual incidence rate divided by seven. The incidence rates were presented on a trend line graph.
Total stillbirths were disintegrated into Fresh stillbirths (FSB) and Macerated stillbirths (MSB). We calculated the proportion of fresh still births out of the total stillbirths. Incidence rate of FSB was equal to number of FSB divided by total deliveries, multiplied by 1000 while incidence rate of MSB was equal to number of MSB divided by total deliveries, multiplied by 1000. The reporting rates were automatically generated by the DHIS2.
We then imported data into Epi info version 7 to do logistics regression analysis so as to determine the significance of the trends. We drew choropleth maps using Quantum Geographic Information System (QGIS) to show the distribution of incidence rates of still-births at the national level in the different districts.
Ethical considerations
The Ministry of Health of Uganda through the office of the Director General Health Services gave approval to access data from the DHIS-2. We stored the abstracted data set in a password protected computer and only shared it with the investigation team. In addition, the office of the Associate Director for Science, U.S. Centers for Disease Control and Prevention, determined that this study was not a human subjects research with the primary intent of improving use of data to guide public health planning and practice.
Results
Trend of annual incidence rate of stillbirths, Uganda, 2014-2020
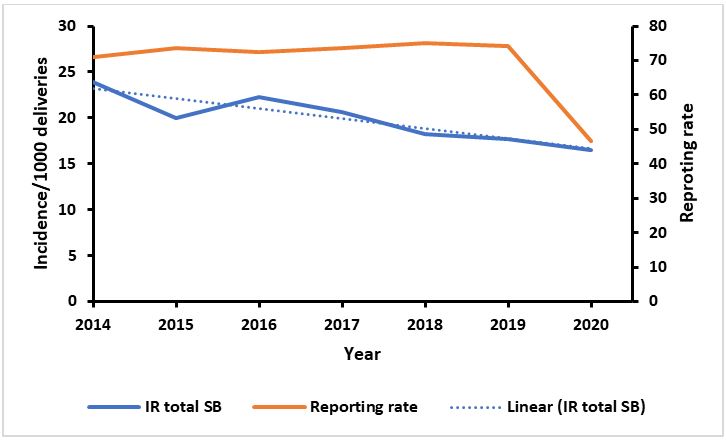
The Incidence rate of still births per 1000 deliveries as recorded by health facilities in Uganda from 2014 to 2020 showed a decline. The mean annual incidence rate over the years was 20 still births per 1000 deliveries. The highest annual incidence over the seven years was recorded in 2014, while the lowest was in 2020. The incidence reduced from 24 stillbirths in 2014, to 20 stillbirths in 2015, and then increased to 22 still births in 2016. The following years of 2017-2020 had an annual decline in stillbirths from 21 to 17 per 1000 deliveries (Figure 1). The reporting rates ranged from 71% to 74% for the period 2014 to 2019; then had a steep decline to 46% in 2020.
The incidence of stillbirths decreased by 6.9% from 2014 to 2020 and the decreasing trend was statistically significant. (OR=0.69; CI=0.67 – 0.70, P<0.001).
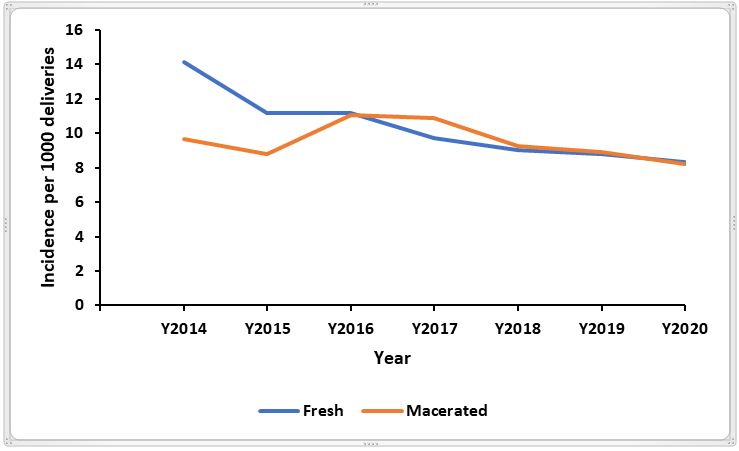
Over the study period, the incidence rate of fresh stillbirths was slightly more than that of macerated stillbirths. In 2014, the incidence of FSB appeared much higher than that of MSB and over the following years the difference narrowed down (Figure 2).
Temporal trends of still-births incidence, regional level, Uganda, 2014-2020
We observed a statistically significant decrease in the incidence rates of still-births per 1,000 deliveries in all the regions of Uganda (Figure 3 and Table 1). Between 2014 and 2020, the central and western regions registered the highest mean annual incidence rate of 22 still-births per 1,000 deliveries while Northern and Eastern regions registered the lowest mean incidence rate of 18 per 1,000 deliveries. The central region had a steep decline in incidence in 2015 and then a rise in 2016, this was followed with a shallow decline in the subsequent years until 2020 (Figure 3).
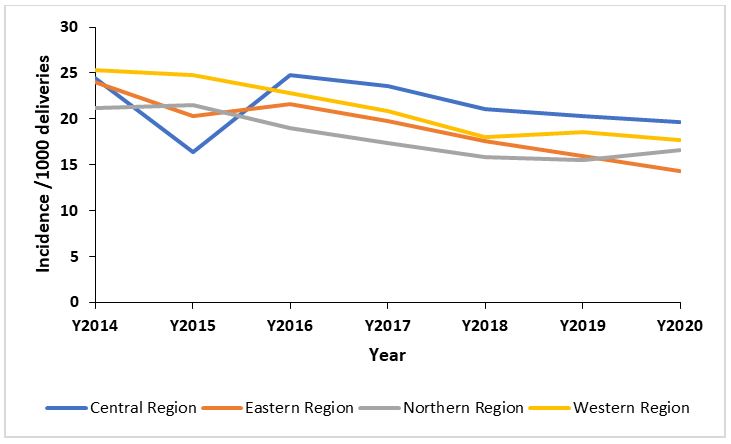
Table 1: Significance of the trends of incidence of still-births, regional level, Uganda, 2017- 2020
| Region | Odds Ratio | 95% CI | P-Value |
| Central Region 2014/2020 | 0.79 | 0.77 – 0.83 | <0.001 |
| Eastern Region 2014/2020 | 0.59 | 0.57 – 0.61 | <0.001 |
| Northern Region 2014/2020 | 0.78 | 0.75 – 0.81 | <0.001 |
| Western region 2014/2020 | 0.69 | 0.66 – 0.72 | <0.001 |
Distribution of still-births incidence, district level, Uganda, 2014-2020
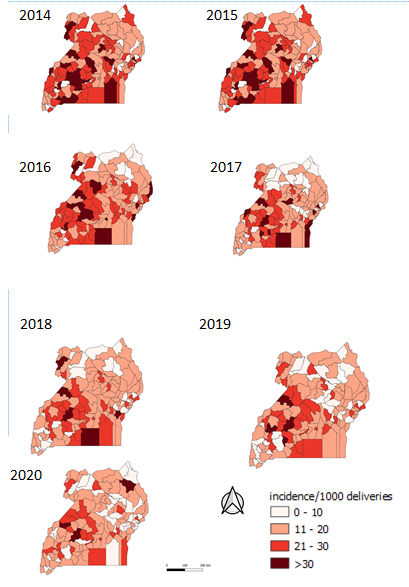
Most of the districts in Uganda had an incidence above the target -10 stillbirths per 1000 deliveries. Generally, there was a minimal decrease in the distribution of stillbirths from 2014 to 2020. About 20 districts registered over 30 stillbirths per 1000 deliveries in 2014 and 2015, this number reduced in 2016. In 2017, about 10 districts had over 30 stillbirths per 1000 deliveries. There were less than 10 districts with over 30 stillbirths in 2019 and 2020. The districts with persistently high incidence of >30 still births per 1000 deliveries included: Mubende, Kalangala, Hoima, and Nebbi (Figure 4).
Discussion
We assessed the distribution, temporal, and spatial trends of stillbirths in Uganda, 2014-2020. The highest annual incidence over the seven years was recorded in 2014, while the lowest was in 2020. Over the study period, the mean still birth rate was 20 still births per 1000 deliveries. Reporting on stillbirths was less than the target for the national target of 80% throughout the study period with 2020 being the worst year. There was a significant decrease in the incidence rate of stillbirths from 2014 to 2020 in Uganda at national and at regional level. This is similar to what has been recorded at the global level where there has been a reduction in stillbirth rate from 2000 to 2019, estimated at 2.3% despite the fact that still births are increasingly concentrated in Sub-Saharan Africa [17, 18].
The highest recorded incidence among the seven years happened in 2014. This is the year ENAP was initiated in Uganda. Through the ENAP initiative health workers across the country were trained in managing deliveries and danger signs of pregnant women. Some of the factors attributed to these deaths included: delay of the mother to seek help from a professional health worker, absence of critical human resource and equipment in health facilities. The causes of deaths included respiratory distress syndrome, birth asphyxia, prematurity and syphilis [19]. By 2019, countries such as South Sudan, Democratic Republic of Congo, Chad, Guinea, and Somalia had more than 25 still births per 1000 deliveries while Uganda had 18 stillbirths per 1000 deliveries[17]..
The incidence of fresh stillbirths was more than that of macerated still births. Similarly, a study in a peri-urban district in Ghana revealed higher fresh stillbirths which was associated with mothers with a parity of 1.6 ± 1.9 compared to mothers with macerated stillbirths who had a parity of 2.54 ± 2.7 [8]. Fresh stillbirths are associated with gaps in care during labor and at delivery while macerated stillbirths are often associated with insults in utero during the antenatal period [21, 22]. Key effective interventions to reduce stillbirths include basic and comprehensive emergency obstetric care. [12].
The rates of reporting on still births were below the target (80%) for each of the years and this affected the representation of the actual burden of still births. The year 2020 had the lowest recorded stillbirths with the lowest reporting rate.
The low reporting rate shows that in 2020 the stillbirths could have been an under-estimate due to the challenges in maternal and child health services delivery caused by the response to the COVID 19 pandemic. This could be attributed to the restrictions of movement of people and vehicles which caused a decrease in services delivered to women as well as delays in seeking care [23-25].
Many stillbirths are potentially preventable and the most common cause is placental insufficiency, followed by maternal medical disorders, hypertensive conditions, and spontaneous preterm birth [26, 27].
Study limitations
We utilized secondary data, which is limited in terms of variables to compressively assess the stillbirth challenge in Uganda. The rate of reporting in the system was less than 80% for all years; this limited us from getting the full representation of the incidence of still births in Uganda. It is possible that, the estimates we are reporting are an under estimate.
Conclusion
Stillbirths incidence rate in Uganda still remains far above the national target for ENAP goals. Specific districts appear to have particularly high still birth rates over the study period. We recommend continuous capacity building in managing pregnant women with emphasis on the most affected districts, and investigation into the reasons for low reporting.
Acknowledgements
We would like to thank the Ministry of Health for providing access to DHIS2 data that was used for this analysis. We also appreciate the technical support provided by the Reproductive Health Department of the Ministry of Health. We acknowledge the Uganda Public Health Fellowship Program for the technical support towards making this analysis.
References
- WHO. Still birth. 2021 [cited 2021 15 November 2021]; Available from: https://www.who.int/health-topics/stillbirth#tab=tab_1.
- UN, UN-IGME-2020-Stillbirth-Report. 2020.
- Zakar, M.Z., et al., Underreporting of stillbirths in Pakistan: perspectives of the parents, community and healthcare providers. BMC Pregnancy and Childbirth, 2018. 18(1): p. 302.
- UNICEF. The global burden of stillbirths. 2020.
- Kiguli, J., et al., Weeping in silence: community experiences of stillbirths in rural eastern Uganda. Global health action, 2015. 8(1): p. 24011.
- Lawn, J.E., et al., Stillbirths: Where? When? Why? How to make the data count? The Lancet, 2011. 377(9775): p. 1448-1463.
- Vanotoo, L., Predictors of Intrapartum Stillbirths in Singletons in Six Public Hospitals in the Greater Accra Region, Ghana. 2019, University of Ghana.
- Aminu, M., et al., Causes of and factors associated with stillbirth in low‐and middle‐income countries: a systematic literature review. BJOG: An International Journal of Obstetrics & Gynaecology, 2014. 121: p. 141-153.
- Arach, A.A.O., et al., Perinatal death in Northern Uganda: incidence and risk factors in a community-based prospective cohort study. Glob Health Action, 2021. 14(1): p. 1859823.
- Lwasa, S., Geospatial analysis and decision support for health services planning in Uganda. Geospatial health, 2007. 2(1): p. 29-40.
- Benova, L., et al., Two decades of antenatal and delivery care in Uganda: a cross-sectional study using Demographic and Health Surveys. BMC Health Services Research, 2018. 18(1): p. 758.
- Bhutta, Z.A., et al., Stillbirths: what difference can we make and at what cost? The Lancet, 2011. 377(9776): p. 1523-1538.
- MOH. guidelines on maternal nutrition in Uganda 2010.
- WHO, Every newborn An action plan to end preventable deaths 2014: Geneva.
- WHO, Every newborn: an action plan to end preventable deaths. 2014.
- Bank, W. Fertility rates, total (births per woman). 2021; Available from: https://data.worldbank.org/indicator/SP.DYN.TFRT.IN?locations=UG.
- Hug, L., et al., Global, regional, and national estimates and trends in stillbirths from 2000 to 2019: a systematic assessment. The Lancet, 2021. 398(10302): p. 772-785.
- Saleem, S., et al., Trends and determinants of stillbirth in developing countries: results from the Global Network’s Population-Based Birth Registry. Reproductive Health, 2018. 15(1): p. 100.
- MOH, N.M.a.P.D.r.o., Why did they die? ”Reviewing the evidence to save tomorrow’s mothers and babies”. 2014, Ministry of Health Uganda: Kampala.
- Berhe, T., H. Gebreyesus, and H. Teklay, Prevalence and determinants of stillbirth among women attended deliveries in Aksum General Hospital: a facility based cross-sectional study. BMC research notes, 2019. 12(1): p. 1-6.
- Osman, N.B., et al., Perinatal outcome in an obstetric cohort of Mozambican women. Journal of tropical pediatrics, 2001. 47(1): p. 30-38.
- Gold, K.J., et al., Assessment of “fresh” versus “macerated” as accurate markers of time since intrauterine fetal demise in low-income countries. Int J Gynaecol Obstet, 2014. 125(3): p. 223-7.
- Burt, J.F., et al., Indirect Effects of COVID-19 on Maternal, Neonatal, Child, Sexual and Reproductive Health Services in Kampala, Uganda. medRxiv, 2021.
- Tumwesigye, N., et al., Effects of the COVID-19 pandemic on health services and mitigation measures in Uganda. Washington: Center for Global Development, 2021.
- Schwartz, J.I., et al., Impact of a COVID-19 National Lockdown on Integrated Care for Hypertension and HIV. Global heart, 2021. 16(1).
- Lawn, J.E., et al., Stillbirths: rates, risk factors, and acceleration towards 2030. The Lancet, 2016. 387(10018): p. 587-603.
- WHO. Still births. 2020 [cited 2020 20/12/2020]; Available from: https://www.who.int/health-topics/stillbirth#tab=tab_1.
Reference this page as below
Petranilla Nakamya1,2*, Allan Komakech1,3, Biribawa Claire1, Stella M. Migamba1,2, Benon Kwesiga1,3, Alex R. Ario1,3 . Trends and geospatial distribution of stillbirths in Uganda, 2014-2020, Kampala, Uganda National Institute of Public Health, 2022 March 30th. Available from:https://uniph.go.ug/trends-and-geospatial-distribution-of-stillbirths-in-uganda-2014-2020.
Comments are closed.