
Yellow fever surveillance system in Uganda, 2012–2022: strengths and weaknesses
Authors: Mercy Wendy Wanyana1*, Patrick King1, Richard Migisha1, Benon Kwesiga1 Paul Edward Okello1, Daniel Kadobeera1, Lilian Bulage1, Alex Riolexus Ario1 Institutional affiliations: 1Uganda Public Health Fellowship Program, Uganda National Institute of Public Health, Kampala, Uganda, 2US Centers for Disease Control and Prevention, Kampala, Uganda *Correspondence: Email: mwanyana@uniph.go.ug, Tel: +25677920792
Summary
Background: Yellow fever re-emerged in Uganda in 2010, after 40 years with four outbreaks reported since 2016. There is limited evidence of the current surveillance system’s capacity for the timely detection and accurate description of disease patterns. We evaluated Uganda’s yellow fever surveillance system (2012–2022) to identify strengths and weaknesses.
Methods: We evaluated selected attributes using secondary data (2012–2022) from the yellow fever surveillance database. Timeliness was assessed by the time lag between symptom onset to sample collection, sample collection to dispatch, sample dispatch to and receipt at the laboratory. External completeness was assessed by the proportion of expected sentinel sites reporting in the system. Internal completeness was assessed proportion of reports with the minimum required data elements filled. Sensitivity was assessed by the proportion of yellow fever cases detected through the systems in previous outbreaks. Usefulness, flexibility, and acceptability were assessed qualitatively.
Results: Between, January 2012 and July 2022, a total of 5,5437 suspected and yellow fever 24 confirmed cases were reported. The median time lag was 3 days (IQR:1-45) between the onset of symptoms and sample collection, 25 days (IQR:9-90) between sample collection and dispatch to the laboratory, and 1 day (IQR:0-1) between dispatch and receipt at the laboratory. External completeness was 100% while internal completeness was 62%. In the years with documented yellow fever outbreaks, sensitivity was 100% except in 2016 when all identified cases were missed by the sentinel system. Stakeholders reported that the surveillance system was useful in detecting outbreaks, and were willing to continue working with the system, but were uncertain about its flexibility.
Conclusion: The yellow fever surveillance system’s strengths included strong laboratory capacities and using both passive and sentinel surveillance approaches. Weaknesses included delays in case confirmation and incomplete data. There is a need to reduce turnaround time from sample collection to testing and improve internal completeness.
Background
Yellow fever is a vaccine-preventable acute viral haemorrhagic fever, transmitted by Aedes mosquitoes from non-human and human primates. Yellow fever has a potentially serious public health impact with a high case fatality (up to 50%) and no specific treatment(2).
Recently, Yellow fever has re-emerged in several high-risk African countries, including Uganda(3–5). Specifically, Uganda has had several outbreaks in the past 6 years with incidence rates ranging from 3 to 13 cases per 100,000 population and a case fatality rate of 33 per 100 population(6,7).
This re-emergence presents new demands on disease surveillance, especially as Uganda joins the rest of the world to eliminate yellow fever epidemics by 2026(8). In the Ugandan situation where vaccination rates remain low despite the high risk(6), there is a need for a surveillance system to monitor the current trends and distribution of yellow fever in Uganda.
This is vital to inform risk assessments which facilitate prioritization of the most appropriate response actions. In addition, timely detection and management of yellow fever cases are key to the containment of outbreaks and consequently elimination of epidemics. However, all this can only be achieved by an effective surveillance system that can accurately and reliably describe disease patterns over time and detects yellow fever cases in time.
Currently, Uganda has both a passive and sentinel surveillance system for yellow fever. The passive surveillance system adopts the Integrated Disease Surveillance and Response (IDSR) approach. In this system, suspected yellow fever cases are routinely reported from all health facilities together with other reportable diseases(9).
On the other hand, in the sentinel surveillance system, seven (7) facilities routinely detect suspected yellow fever cases, collect their samples, and send them to the Uganda Virus Research Institute where they are tested.
However, both yellow fever surveillance systems face numerous challenges including limited access to effective diagnostics; difficulties in the clinical recognition of the disease; poor coordination using the one health approach to surveillance, and untimely reporting(3,10–12).
These may limit the overall effectiveness of yellow fever surveillance system. Currently there is limited evidence on the effectiveness of the surveillance system amidst the highlighted challenges. We described the yellow fever surveillance, mapped the surveillance system’s processes and evaluated them to identify weaknesses and strengths, and suggested recommendations aimed at improving the system in Uganda.
Methods
The evaluation was conducted in Uganda, a yellow fever-endemic country in Eastern Africa(13). Uganda is characterised as a high-risk country for yellow fever transmission due its low vaccination coverage (4% in 2022) and sporadic outbreaks occurring every 3 to 5 years(14).
We used a mixed method design to evaluate the Ugandan yellow fever surveillance system 2012–2022. We used the US Centre for Disease Control’s Updated Guidelines for Evaluating Public Health Surveillance Systems to assess the system’s performance using key attributes(15) .
We described the yellow fever surveillance system’s purpose, operations, current implementation, and processes using a topic guide and a process map. Additionally, we reviewed relevant documents including guidelines and reports to obtain more information on the system’s process and current implementation using a document review guide. We then assessed the surveillance system’s timeliness, external completeness, internal completeness, and sensitivity using data from the yellow fever surveillance database.
We defined timeliness as median time lag from onset of symptoms to sample collection, submission to the laboratory, and dispatch to receipt at the laboratory. We defined external completeness as proportion of expected sentinel sites reporting in the system. We defined internal completeness as the proportion of reports with all the minimum required data elements filled. We defined sensitivity as the proportion of cases detected through the systems in previous outbreaks.
Furthermore, we assessed the system’s usefulness, acceptability, flexibility, and simplicity. We assessed usefulness using perceptions about actions taken as a result of surveillance outputs. We assessed acceptability using perceived willingness of key stakeholder to participate in the surveillance system. We assessed flexibility using the perceived ability of the surveillance system to cope with changes.
We defined simplicity using perceived ease of performing tasks in the yellow fever surveillance system. To assess these attributes (usefulness, acceptability, flexibility and simplicity) we purposively selected key stakeholders at Uganda Virus Research Institute, Ministry of Health, sentinel site health facilities, and non-sentinel site health facilities and conducted key informant interviews.
We used Epi info 7 software (CDC, Atlanta, USA) to analyse quantitative data using descriptive statistics including percentages and medians. Specifically, for timeliness we calculated the median time lag between the onset of symptoms and sample collection, time lag between sample collection and dispatch of sample to the lab and time lag between dispatch to the lab and receipt at the laboratory.
For external completeness we calculated the percentage of the expected yellow fever sentinel sites reporting suspected cases to the yellow fever surveillance system between 2012 to 2022. Internal completeness was calculated as proportion of suspected case records with the all minimum 10 data elements completed as indicated in the WHO Recommended Surveillance Standards, Second edition(16).
Minimum data elements for case-based reporting for yellow fever include: unique identifier, geographical area (District), date of birth, date of onset of symptoms, ever received yellow fever vaccine, date of sample receipt at the laboratory, tests done, date of result, final classification and final outcome.
For sensitivity we calculated the percentage of cases that were reported through the yellow fever surveillance system in previous outbreaks (yellow fever cases reported through the yellow fever surveillance system divided by the total number of yellow fever cases yellow fever outbreaks in that year).
For qualitative data, we transcribed audio-recorded interviews and analysed data using a deductive thematic analysis in Atlas ti 7 software (Scientific Software Development GmbH, Berlin Germany). Transcripts were coded and themes generated based on pre-conceived themes on the yellow fever surveillance system’s usefulness, acceptability, flexibility, and simplicity.
The Ministry of Health Public Health Emergency Operation’s Centre, the custodian of the yellow fever surveillance data, granted administrative clearance for the access and use of the data in the yellow fever database for this assessment. We further sought administrative clearance from the sentinel sites and non-sentinel site health facilities to the use the data.
In-addition, the Office of the Associate Director for Science, U.S. Centers for Disease Control and Prevention, determined that this study was not a human subjects research with the primary intent of using of surveillance data to guide public health planning and practice.
We obtained verbal consent from interviewees including key stakeholders at Uganda Virus Research Institute, Ministry of Health, sentinel site health facilities, and non-sentinel site health facilities facility staff before data collection using a consent form. Data held on computers were encrypted with a password which was made available to the evaluation team.
Results
Description and operations of the yellow fever surveillance system, Uganda, 2012–2022
The Uganda yellow fever surveillance system, adopted two approaches including both passive and sentinel surveillance.
Passive yellow fever surveillance system, Uganda, 2012–2022
Yellow fever is one of the priority conditions requiring immediate reporting under the Integrated Disease Surveillance and Response (IDSR) guidelines. This uses the revised yellow fever case definitions to detect yellow fever cases(17).
However, in practice clinicians use their clinical judgement. All clinically suspected cases of yellow fever are reported on a weekly basis to the District Health Information System 2(DHIS-2), a national integrated disease surveillance system on a weekly basis.
The reporting facility is also supposed to send samples for further investigation to the Uganda Virus Research Institute (UVRI) using the hub laboratory network system. However, in practice samples are not collected from all suspected cases reported weekly and this system does not report laboratory confirmed cases.
Sentinel yellow fever Surveillance system in Uganda,2012–2022
Yellow fever sentinel surveillance is part of the arbovirus surveillance system established by the Department of Arbovirology, Emerging and Re-Emerging Infectious Diseases at UVRI in 2013.The surveillance system aims to 1) prevent outbreaks of zoonotic viruses through early detection; diagnosis, and identification within the region 2) provide risk assessments of the different emerging viruses (transmission, spread, human impact); and 3) recommend and implement public health measures for control where possible.
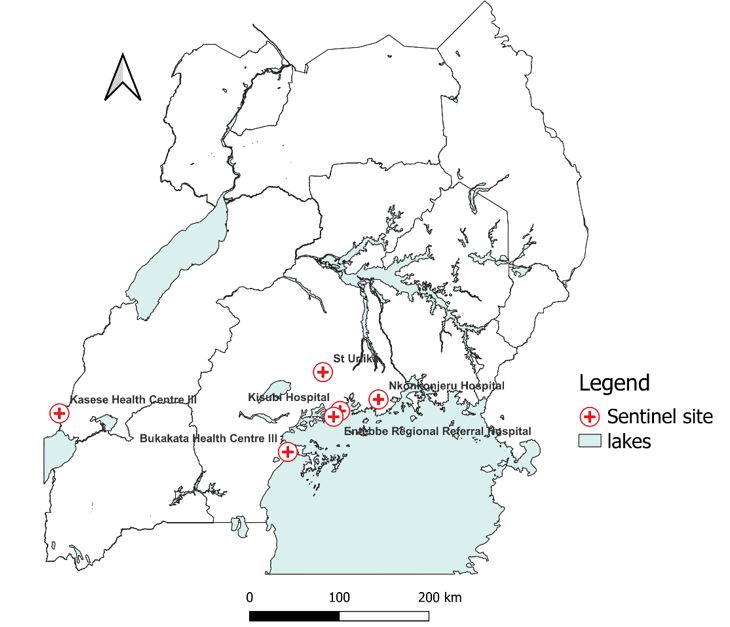
For yellow fever, the surveillance system has seven sentinel sites (Figure 1). These sites were selected based on previous entomological studies that identified yellow fever vectors (Aedes aegypti mosquito species) carrying viruses of the Flaviviridae family in the areas where these facilities are located. The surveillance systems target at-risk yellow fever populations based on their proximity to these “high risk environments”
Processes in the yellow fever sentinel surveillance system, Uganda, 2012–2022
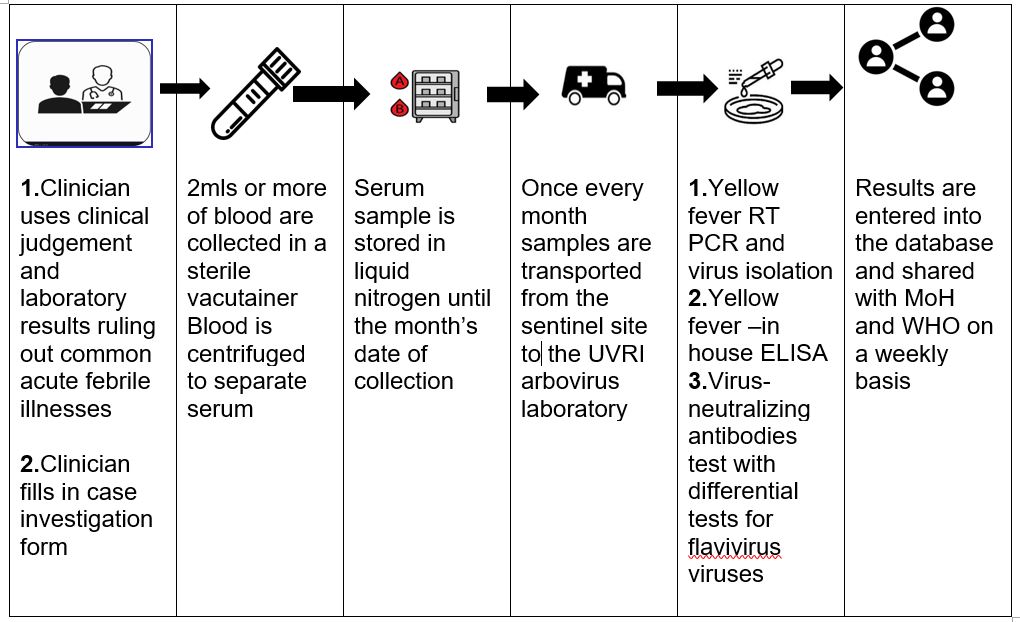
The yellow fever sentinel surveillance system has various processes at the different levels of the surveillance system (Figure 2). The process starts with a clinician in a sentinel site suspecting yellow fever. A blood sample is collected from the suspect case-patient and processed prior to storage in a liquid nitrogen tank till the collection date (once every month).
Additionally, every suspected viral haemorrhagic fever sample submitted to UVRI that is negative for other viral haemorrhagic fever is submitted for yellow fever testing. Samples are tested using the WHO guidelines on laboratory confirmation for yellow fever testing alogarithm(18).Interpretation of results is based on vaccination history, date of onset of symptoms, date of sample collection and travel history.
A positive anti-viral immunoglobulin M (IgM) test with no history of vaccination and Plaque Reduction Neutralisation Test (PRNT) titre of yellow fever ≥ 4 greater than positive PRNT titres of Dengue, West Nile and any other flavivirus is considered as a yellow fever positive test. The laboratory testing process takes a total of 2 weeks. Results are entered into the database and shared with MoH and WHO on a weekly basis.
Personnel and tasks in the yellow fever sentinel surveillance system, Uganda, 2012–2022
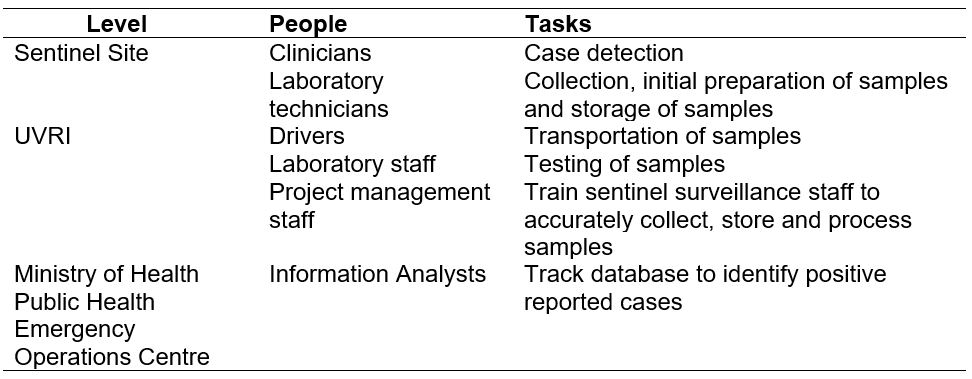
The surveillance system has various personnel responsible for various tasks within the surveillance system as indicated in the (Table 1). These include clinicians, laboratory technicians, drivers, laboratory staff, project management staff and information analysts. However, the yellow fever sentinel surveillance system does not have staff responsible for data analysis and interpretation of surveillance data generated from the surveillance system.
Availability of surveillance guidelines, documents and protocol for the yellow fever surveillance system, Uganda, 2012–2022
All yellow fever sentinel sites reported having received a written protocol and guidelines on sample collection and storage at the establishment of the sentinel sites. However, by the time of the visit some (3/4) of the yellow fever sentinel sites visited had a copy of these documents.
Data flow, reporting, and feedback mechanism for the yellow fever surveillance system, Uganda, 2012–2022
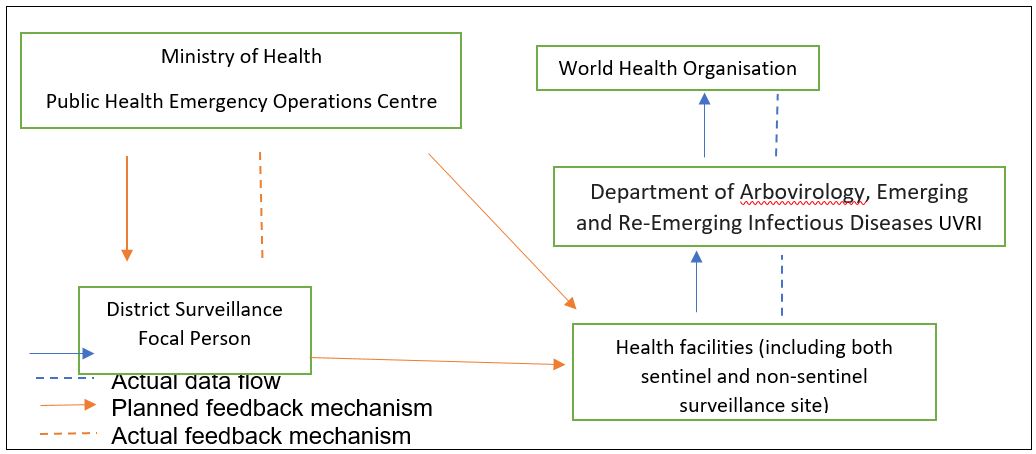
Health facilities (both sentinel and non-sentinel sites) collect data on suspected cases using the UVRI Viral Haemorrhagic Fever case investigation form. Case investigation forms together with samples that are submitted to the Department of Arbovirology, Emerging and Re-Emerging Infectious Diseases at UVRI for testing.
UVRI then submits results of tested samples reports to the Ministry of Health Public Health Emergency Operations Centre (MoH PHEOC) and the World Health Organisation on a weekly basis using an Epi info database. If there are any positive cases reported, the MoH PHEOC notifies the District Surveillance Focal Persons and through email. However, in practice communication and reporting is mainly one way with no feedback to reporting health facilities.
Data management and analysis, yellow fever surveillance system, Uganda, 2012–2022
Data are collected using paper-based case investigation forms at all reporting health facilities. Particularly at yellow fever sentinel sites a summary of the patient information (Name, Residence, Age and sample collection date) recorded in a book are obtained. The case investigation form is submitted to UVRI without a copy left at the health facility. At UVRI, data is entered into an Epi-info database and shared in Microsoft Access with the MoH PHEOC and WHO. Data is not routinely analysed in terms of person, place, and time.
Performance of yellow fever surveillance system based on key attributes, Uganda, 2012–2022
Over the review period, a total of 5,437 suspect cases were reported in the yellow fever surveillance system database. Of these, only 0.44% (n=24) were confirmed as yellow fever cases.
Timeliness
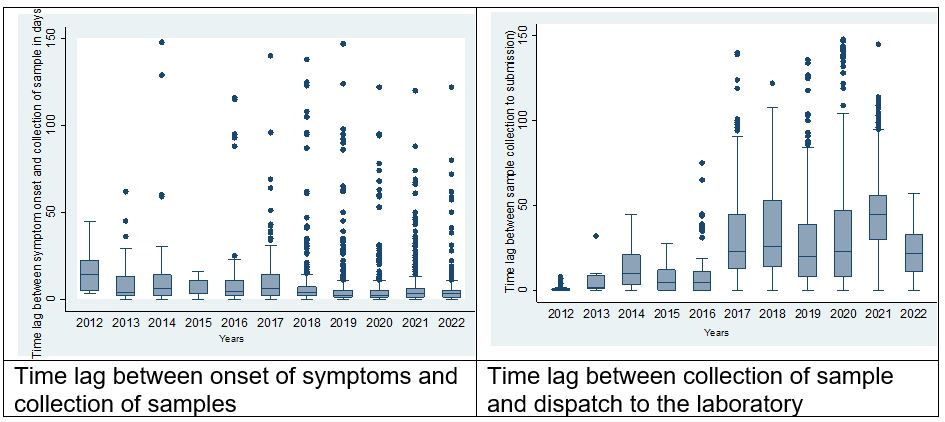
Regarding timeliness, the median time lag between the onset of symptoms and sample collection was 3 days (Interquartile Range (IQR =1- 45). While the median time lag between sample collection and dispatch of the sample to the lab was 25 days (IQR=9-90). The least time lag was observed between sample dispatch and receipt to the laboratory which was 1 day (IQR=0-1). Over the years the median time lag between onset of symptoms and sample collection and the time lag between collection of samples reduced while the time lag between sample collection and dispatch of sample to the laboratory increased.
Completeness
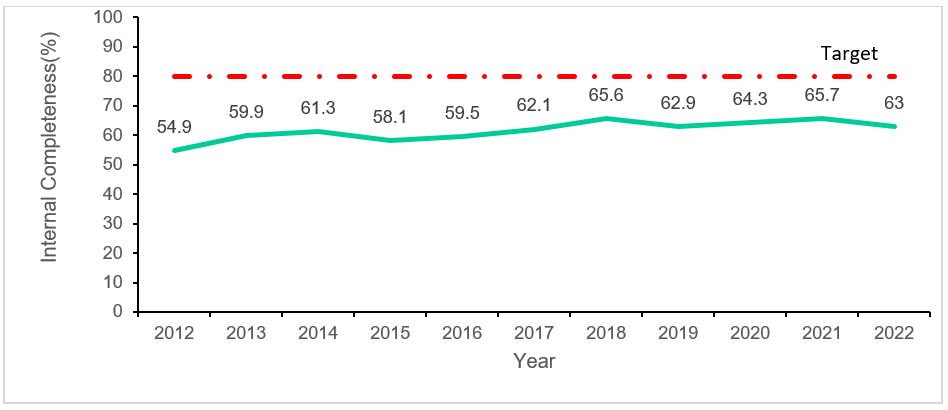
External completeness was (7/7)100% with all the yellow fever sentinel sites reporting suspected cases into the system over the years. Internal completeness was 62%, and this increased over time from 54.9% in 2013 to 63% in 2022.Of the ten data fields analysed for internal completeness, unique identification number, age, yellow fever IgM results and PRNT tests were the most reported data fields with percentages of more than 95%. While vaccination status, IgM result release date and PRNT result release date were the least reported fields at <1%.
Sensitivity
Within the review period, yellow fever outbreaks were recorded in 2016, 2019, 2020 and 2022. The surveillance system was able to detect all the cases reported in the outbreaks except in 2016 resulting in a sensitivity of 100%. This included 5/5 cases in 2019,11/11 cases in 2020 and 1/1 in 2022. In 2016, all the cases in this outbreak were missed.
Usefulness
According to the respondents the yellow fever surveillance system was useful in detecting yellow fever cases and providing data for guiding decisions in selection of interventions for yellow fever prevention and control.
“……the yellow fever surveillance system is very helpful in detecting yellow fever cases…in previous outbreaks most of the yellow fever cases were identified through the sentinel surveillance system….” MoH official, Public Health Emergency Operations Centre
“……the yellow fever surveillance system has enabled us identify which communities are at risk of yellow fever transmission… as a result these have been prioritised in the yellow fever vaccination campaigns last year ….” MoH official, Department of Integrated Epidemiology, Surveillance and Public Health Emergencies
“……currently we use data obtained from the yellow fever surveillance system to advocate for the introduction of the yellow fever vaccine into the routine vaccination schedule…this will start soon ..and if we didn’t have those data to justify our recommendations they would not be taken up….” MoH official, Department of Integrated Epidemiology, Surveillance and Public Health Emergencies
Respondents reported willingness, commitment and interest in participating the Yellow Fever surveillance system. Particularly stakeholders at yellow fever sentinel sites reported their active involvement in the running of the yellow fever surveillance system made it more acceptable to them.
“…We are very committed and willing to participate in the yellow fever surveillance system. For no extra pay we continuously assess and report any suspected yellow fever cases to UVRI….” Health worker at a yellow fever sentinel site.
“… all of us including community members are actively involved in the yellow fever surveillance system and our contributions are valued…we have regular discussions with project managers from UVRI on how we can improve yellow fever surveillance…” Health worker at a yellow fever sentinel site.
Flexibility
Respondents reported uncertainty about the yellow fever surveillance system’s capacity to adapt to the changing surveillance needs. Reasons cited for this uncertainty included: not having experienced a change in yellow fever surveillance needs, being embedded within the integrated disease surveillance system and lack of funding to support flexibility even if it could be needed.
“…We have not experienced any changes in the yellow fever surveillance system………we, therefore, cannot tell how flexible the system is….” MoH official, Department of Integrated Epidemiology, Surveillance and Public Health Emergencies
“.. I don’t know if the yellow fever surveillance system can adapt to the changing surveillance needs especially the passive surveillance which is embedded into the IDSR… it is not easy to make any changes for example in the case definition…….” MoH official, Department of Integrated Epidemiology, Surveillance and Public Health Emergencies
“…. Due to limited funding, the yellow fever surveillance system cannot be as flexible as we would love it to be…. for example, we cannot have more sentinel sites even if we wanted. for example, we experienced a yellow fever outbreak in the northern region of the country in 2016 suggesting a need for enhanced surveillance in this area but no surveillance sites have been set up in this area due to funding… …….” MoH official, Department of Integrated Epidemiology, Surveillance and Public Health Emergencies
Simplicity
Respondents views on the simplicity of the yellow fever surveillance system varied across the sentinel and non-sentinel surveillance sites.
“…the processes are easy and simple… all you have to do is the case investigation form which is easy to fill and wait for UVRI to pick the form…….” Health worker at a yellow fever sentinel site.
“…even if you suspect yellow fever… it may be difficult to send a sample .. sometimes we only end up reporting in the weekly reports …..” Health worker at a yellow fever sentinel site.
Discussion
Prevention and control of yellow fever outbreaks require a reliable and effective surveillance systems. We evaluated Uganda’s yellow fever surveillance system in order to identify strengths and weaknesses. We found several strengths in the surveillance system including case confirmation and reporting processes set up in accordance to standard guidelines, use of both passive and sentinel surveillance approaches, strong laboratory diagnostic capacities, high sensitivity, perceived usefulness, and acceptability of the system to key stakeholders. Weaknesses identified included inconsistent use of standard case definitions among health workers, missed opportunities in case confirmation in the passive surveillance system, lack of routine analysis of surveillance data, delays in case confirmation and incomplete data.
Our findings indicated several strengths in the yellow fever surveillance system. The processes for confirming a yellow fever case and reporting in the yellow fever surveillance system were largely established in accordance with WHO technical guidance on a yellow fever surveillance system and district yellow fever surveillance guidelines(19,20). The yellow fever surveillance system utilised the WHO 2010 revised yellow fever case definitions, which were more sensitive than previous case definitions that included haemorrhagic symptoms(17).
Laboratory testing and algorithms were done in accordance to the yellow fever laboratory diagnostic testing in Africa interim guidance 2016(21). This guided accurate interpretation of results by accounting for vaccination status and possible cross-reaction of other flaviviruses in IgM tests(17).
Additionally, both passive facility-based surveillance system and sentinel surveillance system in high-risk areas were used. Literature(22,23) indicates additional benefits in combining both passive and sentinel surveillance for yellow fever. Sanou et al(22) found that complementing passive surveillance with laboratory based arbovirus sentinel surveillance improved detection of acute febrile illness due to arboviral disease in malaria endemic areas.
This could enhance yellow fever case detection especially in a malaria endemic country like Uganda where non-malarial acute febrile illness are likely to be missed. Furthermore, Sanders et al(24) further indicated that yellow fever sentinel surveillance could enhance case detection especially where the health management information system was lacking.
In terms of key surveillance system attributes, our study found the yellow fever surveillance system was perceived as useful, acceptable and simple by key stakeholders with high sensitivity. Perceived usefulness and acceptability suggested stakeholder’s recognition of the importance of the surveillance system and willingness to participate in the system. The sensitivity of the surveillance system was high except in 2016. In 2016, yellow fever cases with haemorrhagic symptoms were suspected to have other viral haemorrhagic fever including Ebola Virus, Marburg Virus, Crimean-Congo Haemorrhagic Fever, and Rift Valley Fever(6).This might suggest a low suspicion index of yellow fever among health workers. Such missed opportunities in detection of cases may lead to delay in outbreak detection and response.
We noted several weaknesses which may limit the effectiveness of the surveillance system. Despite the availability of standard case definitions, these were not used routinely by health workers. The limited use of standard case definitions could be attributed to the fact that only a few health workers had being trained in the national technical guidelines for integrated disease surveillance and response(25).
Our findings further indicated that not all suspected cases reported in the passive surveillance system had laboratory investigations conducted presenting a missed opportunity in detecting yellow fever cases. Furthermore, there was limited interoperability between the two surveillance systems. Previous studies conducted in Uganda indicated that high proportion of suspected yellow fever cases were not investigated and possibly undetected(26). Additionally, data were not routinely analysed, hence, limiting monitoring of disease trends and use of these data for decision making(27).
With regard to key attributes, we found sizeable time lags which were higher than the expected WHO thresholds(21,27). For example, it took >3 weeks of a collected sample to be shipped to the laboratory instead of the recommended less than 24 hours or less. Similar findings have been reported in Central African Republic, and other African yellow fever endemic countries with challenges in transportation of laboratory samples(28).
Such delays may hinder timely detection of yellow fever outbreaks. Although external completeness was high (above expected 90% based on the WHO recommended standards for yellow fever surveillance), internal completeness was very low(16). This may present difficulties in conducting case investigations. Particularly, very low completeness (<1%) was recorded for key fields such as vaccination status which are critical to interpretation of results.
Limitations
Our findings should be interpreted with the following limitations. Although the qualitative approach elicited respondents’ in-depth perspectives on the surveillance system attributes, these could have been biased due to social-desirability. The positive predictive value of the system could not be ascertained as only the gold standard measurement of yellow fever diagnostics were used.
In conclusion, the yellow fever surveillance system had strong laboratory testing capacities and using both passive and sentinel surveillance approaches. Weaknesses included missed opportunities in case confirmation in the passive surveillance system, delays in case confirmation, incomplete data and limited routine analysis of data. There is need to reduce turnaround time from sample collection to testing, improve internal completeness, perform routine analysis and address missed opportunities in case confirmation in the passive surveillance system.
Conflict of interest
The authors declare that they had no conflict of interest.
Acknowledgements
The authors thank the staff of the Public Health Fellowship Program for the technical support and guidance offered during this study. We would like to thank the UVRI Department of Arbovirology, Emerging and Re-Emerging Infectious Diseases for providing technical support and guidance provided during this evaluation. We appreciate the technical support provided by the Division of Surveillance, Information and Knowledge Management. The authors extend their appreciation to the management and staff of the sentinel and non-sentinel site health facilities who participated in this evaluation.
Copyright and licensing
All materials in the Uganda Public Health Bulletin is in the public domain and may be used and reprinted without permission; citation as to source; however, is appreciated. Any article can be reprinted or published. If cited as a reprint, it should be referenced in the original form
- Eldridge S, Kerry S. A Practical Guide to Cluster Randomised Trials in Health Services Research [Internet]. First Edit. West Sussex: John Wiley & Sons; 2012. 11 p. (Statistics in practice). Available from: https://onlinelibrary-wiley-com.manchester.idm.oclc.org/doi/pdf/10.1002/9781119966241
- WHO (World Health Organisation). Yellow fever: rapid field entomological assessment during yellow fever outbreaks in Africa: handbook: methodological field approaches for scientists with a basic background in entomology [Internet]. Geneva PP – Geneva: World Health Organization; 2014. Available from: https://apps.who.int/iris/handle/10665/112785
- Nomhwange T, Jean Baptiste AE, Ezebilo O, Oteri J, Olajide L, Emelife K, et al. The resurgence of yellow fever outbreaks in Nigeria: a 2-year review 2017–2019. BMC Infect Dis [Internet]. 2021;21(1):1054. Available from: https://doi.org/10.1186/s12879-021-06727-y
- Gardner CL, Ryman KD. Yellow fever: a reemerging threat. Clin Lab Med [Internet]. 2010 Mar;30(1):237–60. Available from: https://pubmed.ncbi.nlm.nih.gov/20513550
- Wamala JF, Malimbo M, Okot CL, Atai-Omoruto AD, Tenywa E, Miller JR, et al. Epidemiological and laboratory characterization of a yellow fever outbreak in northern Uganda, October 2010-January 2011. Int J Infect Dis IJID Off Publ Int Soc Infect Dis. 2012 Jul;16(7):e536-42.
- Kwagonza L, Masiira B, Kyobe-Bosa H, Kadobera D, Atuheire EB, Lubwama B, et al. Outbreak of yellow fever in central and southwestern Uganda, February–may 2016. BMC Infect Dis [Internet]. 2018;18(1):548. Available from: https://doi.org/10.1186/s12879-018-3440-y
- Nwaiwu AU, Musekiwa A, Tamuzi JL, Sambala EZ, Nyasulu PS. The incidence and mortality of yellow fever in Africa: a systematic review and meta-analysis. BMC Infect Dis [Internet]. 2021;21(1):1089. Available from: https://doi.org/10.1186/s12879-021-06728-x
- Organization WH. A global strategy to eliminate yellow fever epidemics ( EYE) 2017–2026. 2018;
- MoH (Minstry of Health Uganda). National Technical Guidelines for Integrated Disease Surveillance and Response Third Edition [Internet]. 2021. Available from: https://www.afro.who.int/sites/default/files/2021-09/2_Uganda 3rd IDSR Tech Guideline_PrintVersion_10Sep2021.pdf
- Johansson MA, Vasconcelos PFC, Staples JE. The whole iceberg: estimating the incidence of yellow fever virus infection from the number of severe cases. Trans R Soc Trop Med Hyg [Internet]. 2014/06/30. 2014 Aug;108(8):482–7. Available from: https://pubmed.ncbi.nlm.nih.gov/24980556
- WHO (World Health Organisation). WHO report on global surveillance of epidemic-prone infectious diseases [Internet]. World Health Organization; 2000. Available from: https://www.who.int/csr/resources/publications/surveillance/Yellow_fever.pdf
- Ingelbeen B, Weregemere NA, Noel H, Tshapenda GP, Mossoko M, Nsio J, et al. Urban yellow fever outbreak-Democratic Republic of the Congo, 2016: Towards more rapid case detection. PLoS Negl Trop Dis [Internet]. 2018 Dec 7;12(12):e0007029–e0007029. Available from: https://pubmed.ncbi.nlm.nih.gov/30532188
- WHO (World Health Organisation). Yellow Fever- Uganda [Internet]. 2022 [cited 2023 Feb 2]. Available from: https://www.who.int/emergencies/disease-outbreak-news/item/2022-DON367#:~:text=Uganda is endemic for yellow,Fever Epidemics (EYE) Strategy.
- WHO (World Health Organisation). Yellow Fever Uganda [Internet]. 2022 [cited 2022 Aug 19]. Available from: https://www.who.int/emergencies/disease-outbreak-news/item/2022-DON367#:~:text=Uganda has not introduced the,and Koboko (2019)%2C in
- (US CDC) USC for DC and P. Updated guidelines for evaluating public health surveillance systems: recommendations from the guidelines working group. MMWR Recomm Rep. 2001;50(13):1–35.
- WHO (World Health Organisation). WHO recommended surveillance standards. World Health Organization; 1999.
- WHO (World Health Organisation). Yellow fever surveillance and outbreak response: revision of case definitions, October 2010. Wkly Epidemiol Rec Relev épidémiologique Hebd. 2010;85(47):465–72.
- WHO (World Health Organisation). Yellow fever laboratory diagnostic testing in Africa: Interim guidance, 2016. 2016.
- WHO (World Health Organisation). Technical guide for a system of yellow fever surveillance =Guide technique pour l’établissement d’un système surveillance de la fièvre jaune. Wkly Epidemiol Rec = Relev épidémiologique Hebd. 1971;46(49):493–500.
- WHO (World Health Organisation). District guidelines for yellow fever surveillance. World Health Organization; 1998.
- WHO (World Health Organisation). Yellow fever laboratory diagnostic testing in Africa. World Health Organization; 2016.
- Sanou AS, Dirlikov E, Sondo KA, Kagoné TS, Yameogo I, Sow HE, et al. Building Laboratory-Based Arbovirus Sentinel Surveillance Capacity During an Ongoing Dengue Outbreak, Burkina Faso, 2017. Heal Secur [Internet]. 2018 Nov 27;16(S1):S-103-S-110. Available from: https://doi.org/10.1089/hs.2018.0048
- Sanders EJ, Borus P, Ademba G, Kuria G, Tukei PM, LeDuc JW. Sentinel surveillance for yellow fever in Kenya, 1993 to 1995. Emerg Infect Dis. 1996;2(3):236–8.
- van der Elst EM, Okuku HS, Nakamya P, Muhaari A, Davies A, McClelland RS, et al. Is audio computer-assisted self-interview (ACASI) useful in risk behaviour assessment of female and male sex workers, Mombasa, Kenya? PLoS One. 2009;4(5):e5340.
- Nakiire L, Masiira B, Kihembo C, Katushabe E, Natseri N, Nabukenya I, et al. Healthcare workers’ experiences regarding scaling up of training on integrated disease surveillance and response (IDSR) in Uganda, 2016: cross sectional qualitative study. BMC Health Serv Res. 2019 Feb;19(1):117.
- Bosa HK, Majwala R, Nakiire L, Ario AR, Kiwanuka N, Kibuuka H, et al. Missed opportunities for Yellow Fever Surveillance in Uganda, July 2015 – May 2016. Int J Infect Dis [Internet]. 2016 Dec 1;53:116–7. Available from: https://doi.org/10.1016/j.ijid.2016.11.291
- Organization WH. Manual for the monitoring of yellow fever virus infection. World Health Organization; 2004.
- Rachas A, Nakouné E, Bouscaillou J, Paireau J, Selekon B, Senekian D, et al. Timeliness of yellow fever surveillance, Central African Republic. Emerg Infect Dis. 2014 Jun;20(6):1004–8.
Comments are closed.