
HIV Positivity Rate and Recent HIV Infections Among Adolescent Girls and Young Women 10-24 years, Uganda, 2017-2021
Authors: Patience Mwine1*, Benon Kwesiga1,2, Richard Migisha1,2 Steven Kabwama1,2 Juliet Cheptoris3, Peter Mudiope3, Emmy Muramuzi3, Daniel Kadobera1.2, Lilian Bulage1,2, Alex R. Ario1,2 Institutional affiliations: 1Uganda Public Health Fellowship Program, Kampala, Uganda 2Uganda National Institute of Public Health, Kampala, Uganda 3Ministry of Health, Kampala Uganda *Correspondence: Email: pmwine@musph.ac.ug, Tel: +256-702-449-738
Summary
Background: New HIV infections still occur among adolescent girls and young women (AGYW) in Uganda despite HIV prevention programs. We described the HIV test positivity and recent infection (acquired in the past ~12 months) rates among AGYW from 2017 to 2021 to inform targeted planning for additional interventions among AGYW.
Methods: We analyzed routine HIV testing program data from 2017-2021 for AGYW (aged 10-24 years) reported through the District Health Information System 2 (DHIS2) and from the 600 clinical sites that test for HIV recency in Uganda. We evaluated trends in the positivity rate at national and district levels and used logistic regression to determine significance. We calculated the proportion of infections among AGYW newly diagnosed with HIV from November 2019-November 2021 that were recent and identified geographic clusters of infections (defined as ≥5 recent infections in a sub-county within 12 months).
Results: Of 8,532,992 HIV tests, 168,633 (2.0%) were positive. AGYW aged 20-24 had the highest rate (2.6%, 95%CI 2.5-2.6). There was a 5% (OR=0.95, 95% CI; 0.94-0.95) significant reduction in the trend of HIV positivity rate from 2.0% in 2017 to 1.7% in 2021. The district HIV positivity rate decreased in most districts but remained persistently >3% yearly in Mbarara, Sheema, Rwampala, and Kalangala districts. Among 2,672 newlydiagnosed AGYW aged 15-24 with a recency test, 359 (13.4%) had recent HIV infections. Most (276; 74.4%) were 20-24 years, 113(31.5 %) were first-time testers, and 47 (13.1%) were pregnant or breastfeeding. We observed clusters of recent HIV infections in subcounties bordering the Democratic Republic of Congo (DRC), Western Uganda, and central divisions of Kampala Metropolitan.
Conclusions: HIV positivity rate among AGYW declined overall during 2017-2021, but specific Western Ugandan districts had comparatively elevated rates. Nearly one in seven HIV infections were acquired recently, and clusters of recent HIV infections were in some sub-counties. The Ministry of Health could strengthen HIV prevention and scale-up testing among AGYW in the most affected districts and initiate outbreak investigations in communities with clusters of recent HIV infections.
Introduction
Worldwide, 3.9 million young people aged 15- 24 are estimated to be living with HIV/AIDS; seventy per cent of these are in Sub-Saharan Africa (1). According to the Joint United Nations Programme on HIV/AIDS (UNAIDS) 2020 report, around 4,200 new HIV infections occur among Adolescent Girls and Young Women (AGYW) 15-24 years every week; and six in seven new HIV infections were among adolescent girls 15-19 in Sub-Saharan Africa (2). In 2017, about 1.4 million persons were living with HIV/AIDS in Uganda, according to Uganda’s Population-Based HIV Impact Assessment (UPHIA) (4).
Over the last decade, HIV prevalence among 15-60 years has progressively reduced from 7.3% to 5.6% (5). According to the United Nations International Children’s Emergency Fund (UNICEF) report, Uganda registered 53,000 new HIV infections in 2019, and two-thirds were among AGYW (6). AGYW are four times more affected than their male counterparts (5); in 2017, an estimated 250 AGYW got infected weekly compared to 90 male counterparts (4). The high incidence of new HIV infections among AGYW is due to poverty, gender-based violence, lack of access to education, health care services, social protection, and information on HIV prevention (8).
These have led young women and adolescents to be less likely to negotiate for safer sex and engage in risky sexual behaviours that predispose them to HIV infections. In 2016, Uganda implemented a multisectoral AGYW HIV prevention approach to reduce the new HIV infections (9). Program activities aim to empower young girls who are not HIV positive to remain negative and link those already positive to care through the Determined, Resilient, Empowered, AIDS-free, Mentored, and Safe (DREAMS) project (10).
These strategies include behavioural change communication, keeping girls in school, use of condoms, use of Pre Exposure Prophylaxis (PrEP) among the risk groups, reducing genderbased violence, and many others (9). To monitor the progress and impact of these program activities to reduce new HIV infections among AGYW, we analyzed HIV testing services data in the District Health Information System 2 (DHIS2). We described the HIV positivity rate (2017-2021) and recent infections (November 2019-December 2021) among AGYW in Uganda to inform targeted planning for additional interventions among AGYW.
Methods
Study setting
For this study, we considered HIV Testing Services (HTS) data reported from all health facilities across the country. Uganda has a total of 146 districts, including the cities, and as of 2022, the estimated population is 44.2 million people. According to the Ministry of Health, Uganda has 6,937 health facilities (public, private and private not-for-profit). Of these, 3,133 (45.2%) are Government-owned, 1,002 (14.4%) are Private and Not For Profit (PNFP), while the remaining 2,795 (40.3%) are Private For-Profit (PFP) and 7 (0.1%) community-owned facilities (11).
All health facilities provide HIV testing services according to the national HIV testing algorithm (12). In 2019, Uganda rolled out recency testing in 35 five sites (health facilities), which increased gradually to 600 recency sentinel sites at the end of 2021 (13). Recent HIV Infections surveillance system was established in the routine HIV testing to identify recent infections (acquired in the past ~12 months) among newly identified HIVpositive clients above 15 years of age. This system is meant to inform HIV epidemic control on the subpopulation most affected, map host spots for recent HIV infections, identify clusters of recent HIV infections and guide HIV prevention interventions (14).
Study design and data source
We conducted a descriptive analysis of surveillance data on HTS among AGYW (10-24 years) recorded from January 2017 to December 2021 in the DHIS2). The DHIS2 is an integrated data collection system used by the Ministry of Health to support planning, management, and decision-making in health facilities and organizations. Clients access HIV testing services at different points of care, including; outpatient departments (OPD), laboratory, antenatal care (ANC), and HIV/AIDS clinics.
Health workers record HTS patient data in various HTS registers (HMIS 105), and health facility data clerks compile monthly summary reports submitted to the district. At the district, the Biostatistician uploads all health facility HTS aggregated data into the DHIS2 under data element “105-HT18j” and can be accessed at the national level. We also analyzed the HIV recency data of AGYW from Nov 6, 2019, to Nov 22, 2021, reported from 600 Recency sentinel sites where a recency testing program was being implemented in Uganda at the time (13).
We accessed these data from the Uganda Electronic Medical Records (EMR) system with permission from the Monitoring and Evaluation Technical Support Program (METS). Recency testing is done among newly-identified HIV-positive clients aged 15 years and above as one of Uganda’s National HIV Surveillance frameworks to monitor and control the epidemic. Recency testing uses a rapid testing kit known as Asante HIV-1 Rapid Recency Assay (ARRA). Asante is a simple, quick antibody test that distinguishes recent (most likely acquired within the past 12 months) from long-term infections (most likely acquired earlier than 12 months prior) using antibody avidity (15).
Study variables, data extraction, and analysis
From the DHIS2, we extracted data on HIV testing results from 2017 to 2021 for AGYW 10-24 under data element “105-HT18j”. We obtained information on the district, age, total AGYW tested, and positives. We also extracted the average national reporting rates for HTS results for 2017-2021 to compare them with the positivity rate. We determined the HIV positivity rate as a proportion of AGYW who tested HIV positive through the national testing program from 2017 to 2021. We described the HIV positivity rate among AGYW in terms of place using the district variable, person by age, and time by year trends.
We demonstrated the national trend of HIV positivity rate among AGYW 10-24 years as line graphs. We compared the average annual national reporting rates using the same line graphs with the HIV positivity rate trend to determine if they affected the positivity rates. We described the district trends as choropleth maps drawn using the Quantum Geographic Information System (QGIS 3.22). We carried out logistic regression to determine the significance of the trend and summarized the results as an odds ratio at a 95% Confidence Interval.
We applied a similar analysis to the HIV recency data on AGYW in Uganda to determine the proportion of recent HIV infections by person and geographic distributions of recent HIV infections (acquired within the past 12 months) among AGYW. We described the proportions of recent infections by other variables, including age, first-time testing, special category, and reason for testing. Using choropleth maps, we demonstrated the spatial distribution of the number of recent infections as clusters at the sub-county level (≥5 recent infections in a subcounty within 12 months).
Ethical Considerations
We used secondary data with no identifiers; hence, ethical approval was not required. We obtained permission to access data from METS, which manages recency testing data, and the Ministry of Health (MOH). In addition, a non-research determination form was submitted to US CDC for clearance before the commencement of the project as a requirement. The Office of the Associate Director for Science, U.S. Centers for Disease Control and Prevention, determined our project as non-human subjects research; this was in response to a public health problem with the primary intent of public health practice (epidemic disease control).
Results
Trends of HIV Positivity rate among Adolescent Girls and Young Women 10-24 years, Uganda, 2017 -2021
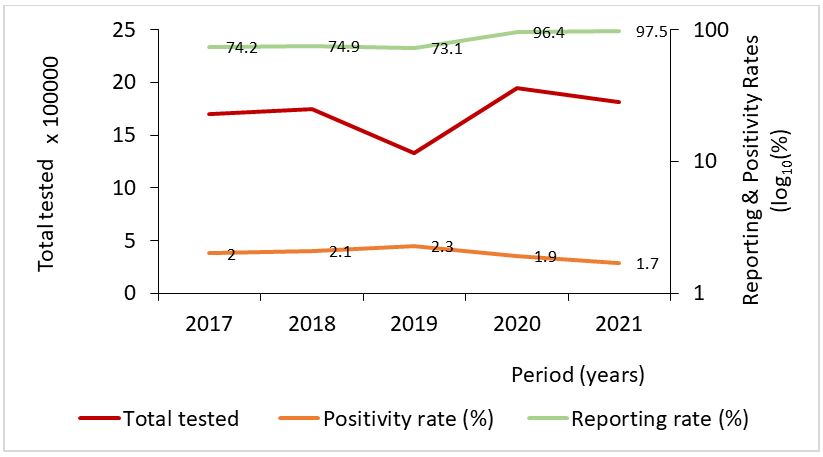
Overall, 8,532,992 Adolescent Girls and Young Women 10-24 years tested for HIV between January 2017 to December 2021. Of these, 168,633 (2.0 %) tested HIV positive during the five years (Table 1). Overall, there was a significant 5% [OR=0.95 CI 0.94-0.95] decline in HIV positivity among AGYW who accessed HIV testing services. There was a significant
initial 16% increase in the positivity rate from 2017 to 2019, which later declined significantly in 2020 and 2021 (Table 1 and Figure 1).
| Year | Total tested | Tested Positive | Positivity rate (%) | OR | 95% CI |
| 2017 | 1,697,614 | 34,357 | 2.0 | Ref | – |
| 2018 | 1,750,841 | 36901 | 2.1 | 1.04 | (1.03-1.06) |
| 2019 | 1,326,172 | 31035 | 2.3 | 1.16 | (1.14-1.18) |
| 2020 | 1,948,826 | 36200 | 1.9 | 0.92 | (0.90-0.93) |
| 2021 | 1,809,539 | 30140 | 1.7 | 0.82 | (0.81-0.83) |
| Total | 8,532,992 | 168633 | 2.0 | 0.95 | (0.94-0.95) |
The number of HIV tests increased over the years, except for the observed sharp decline of 21% in 2019. The HIV positivity rate initially rose from 2.0 % in 2017 to 2.3 % in 2019 and then decreased to 1.7% in 2021 (Figure 1).
The reporting rates for HIV testing services were about 75% between 2017 and 2019 but sharply increased to above 95% in 2020 and 2021 (Figure 1).
HIV positivity rate among Adolescent Girls and Young Women by age group, Uganda, 2017-2021
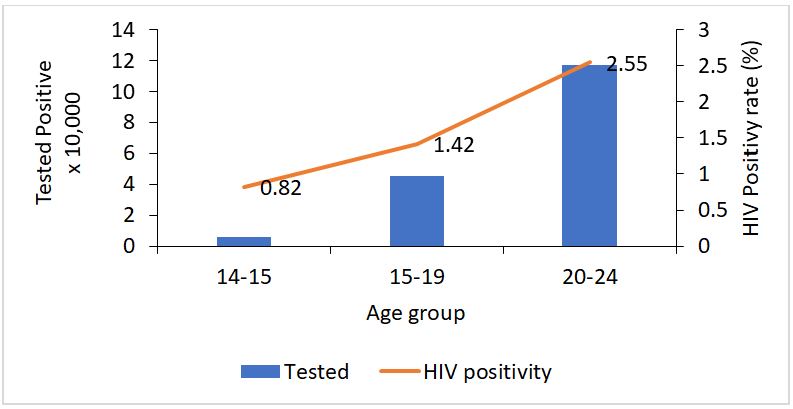
The HIV positivity rate varied among the different age categories, and young women 20-24 years had the highest HIV positivity rate of 2.55% (Table 2). Additionally, the positivity rate increased with age (Figure 2).
Table 2: HIV positivity rate among Adolescent Girls and Young Women by age groups, Uganda, 2017-2021
| Age
Category |
Total
Tested |
Tested
Positive |
HIV positivity
rate (%) |
95% Confidence Interval |
| 10-14 | 732,433 | 5,972 | 0.82 | (0.80-0.84) |
| 15-19 | 3,204,505 | 45,381 | 1.42 | (1.40-1.43) |
| 20-24 | 4,596,054 | 117,280 | 2.55 | (2.54-2.57) |
Spatial distribution of HIV positivity rate among Adolescent Girls and Young Women 10-24 year, Uganda, 2017-2021
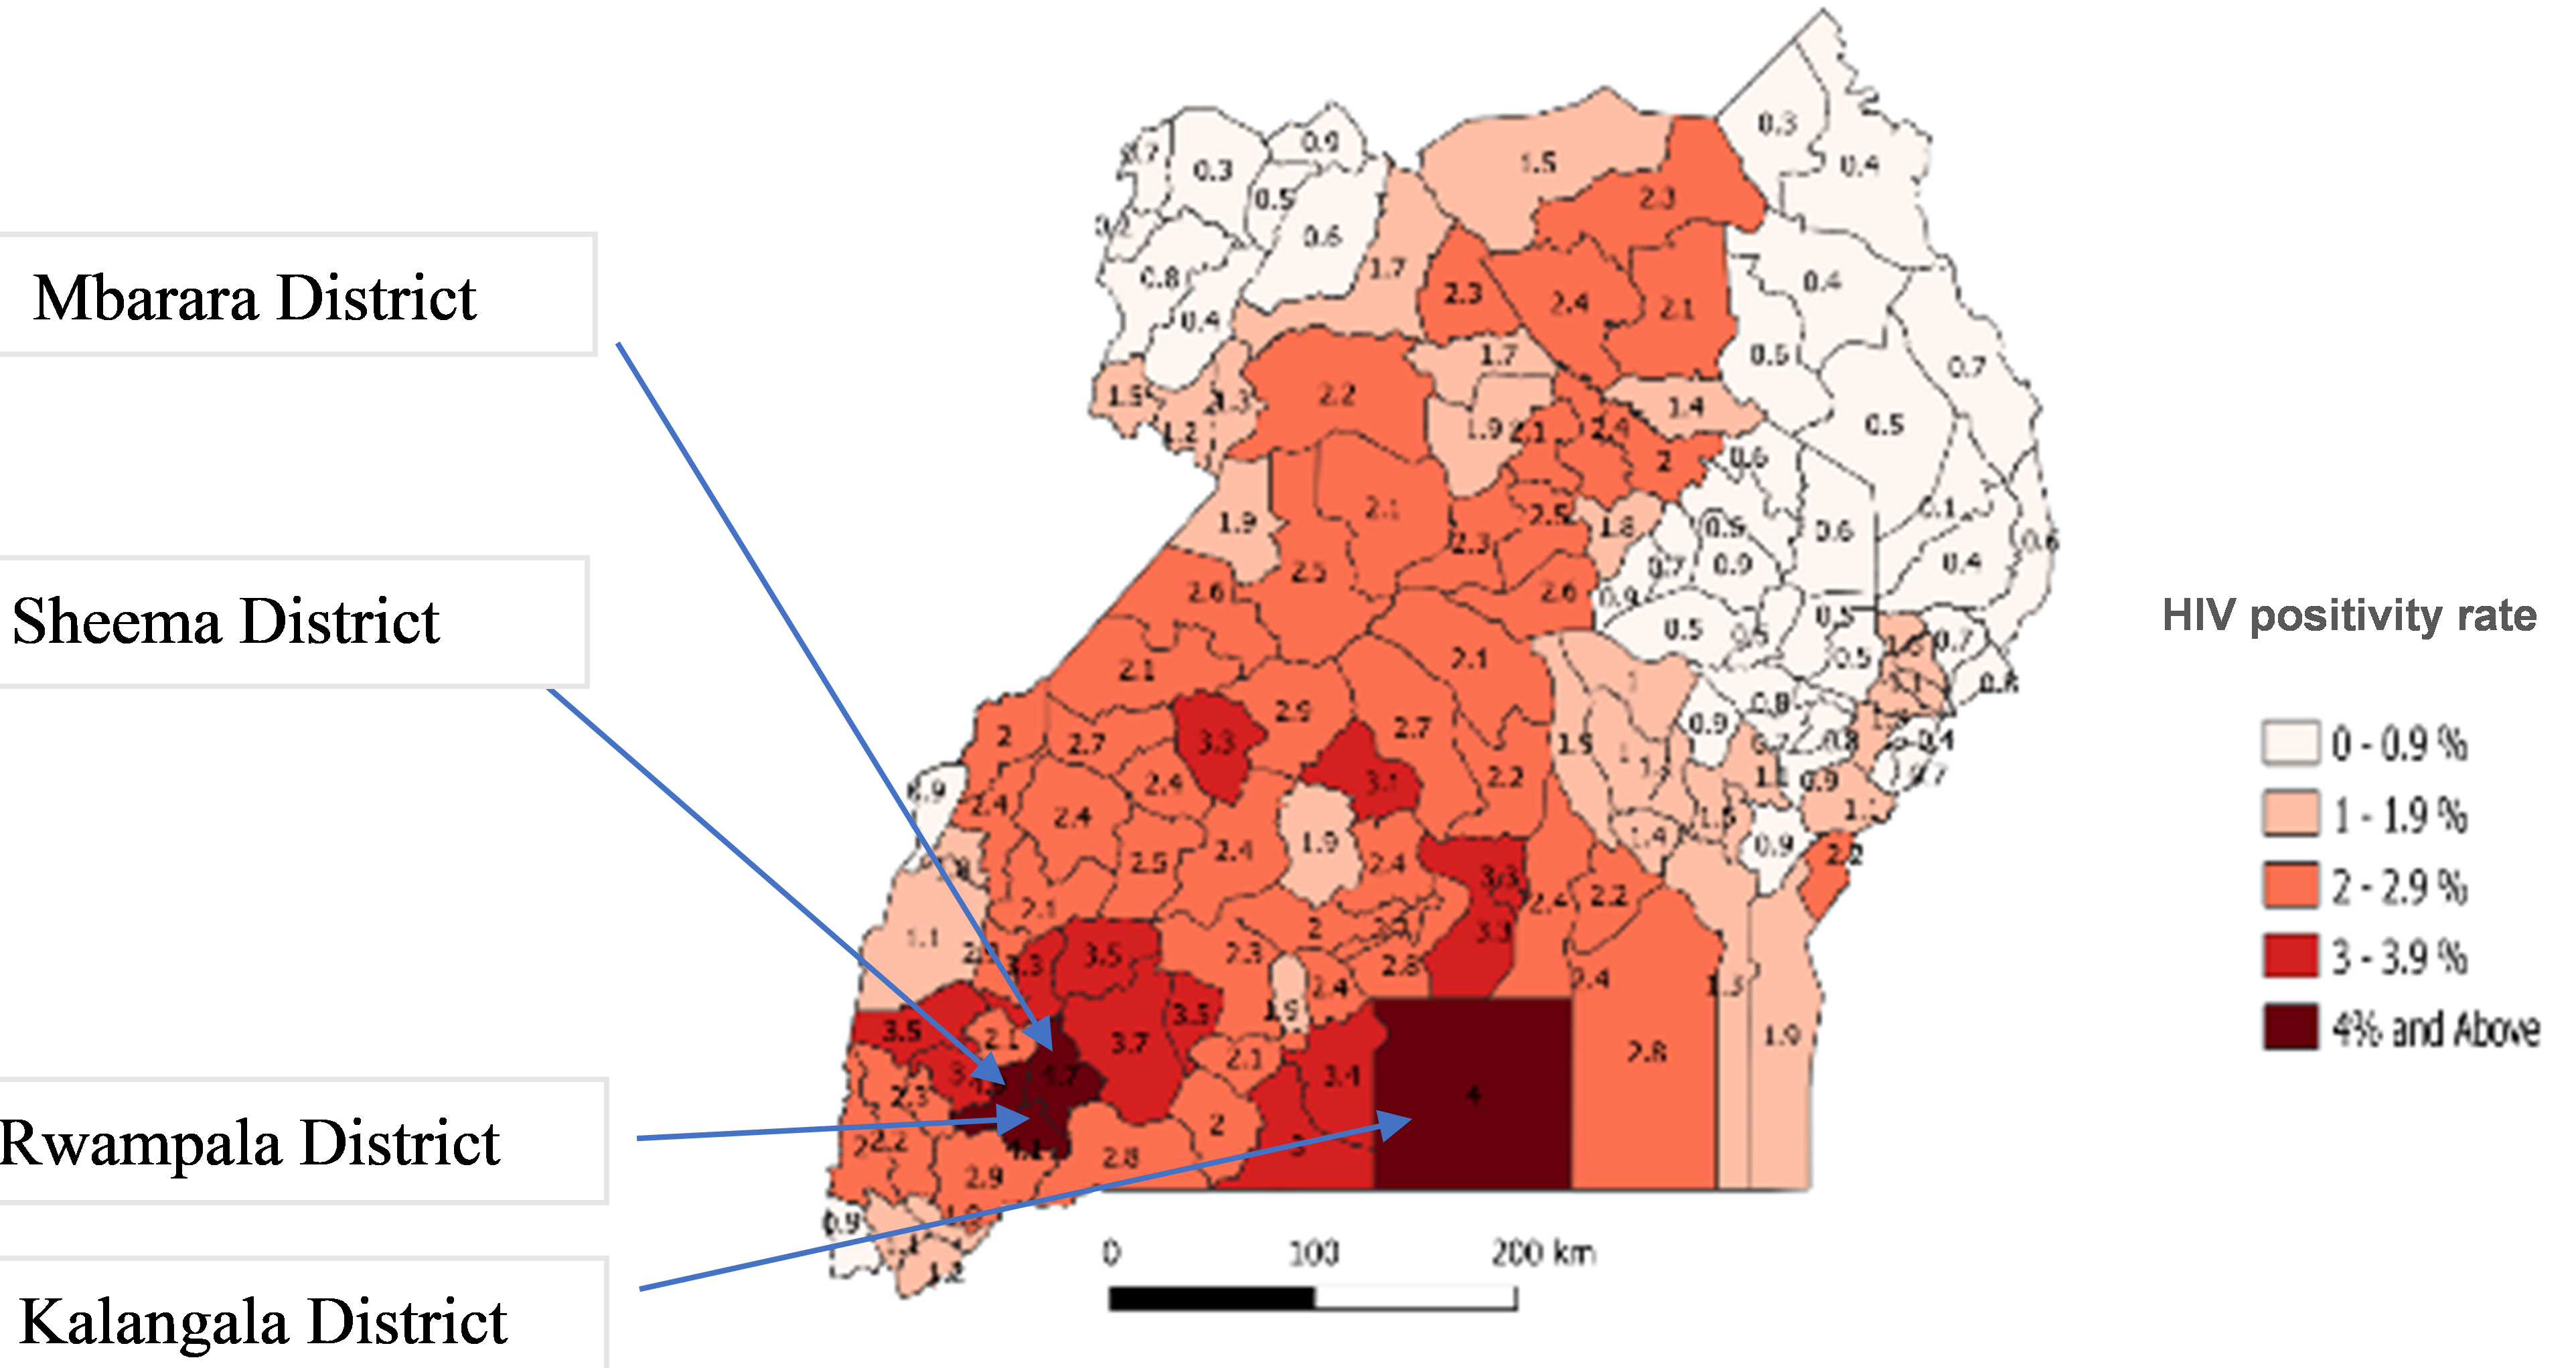
Overall, we established a variation in the HIV positivity rate among the different districts. The Western and Central districts demonstrated high HIV prevalence, and the Eastern region had the least. Furthermore, Mbarara, Sheema, Rwampala, and Kalangala districts had an elevated five-year positivity rate of >4% (Figure 3).
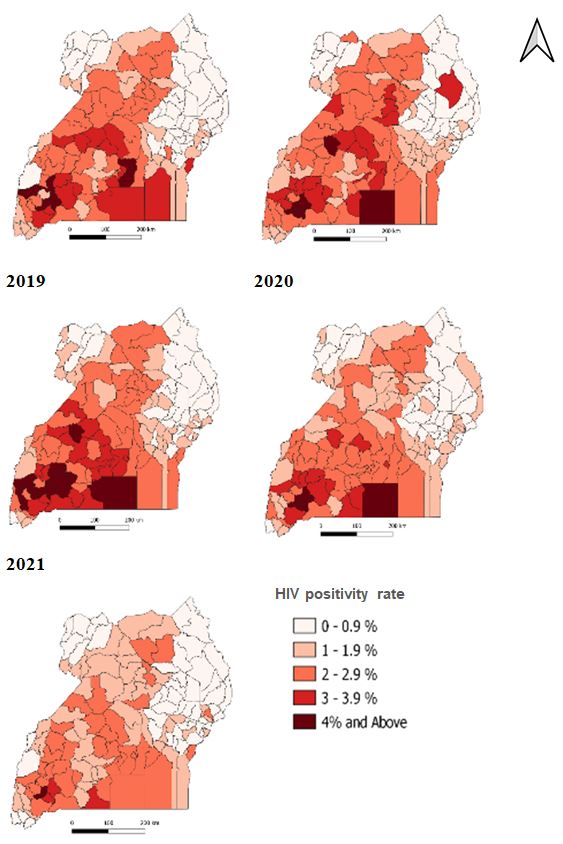
The trend of HIV positivity by district decreased with years as the number of districts with high prevalence reduced except in 2019. Despite the decreasing HIV trend, Mbarara, Sheema, Rwampala, and Kalangala districts remained with an HIV positivity rate of greater than 3% in all the years (Figure 4)
Recent HIV infections among Adolescent Girls and Young Women 15-24 years, Uganda, 2019-2021
A total of 2,672 adolescent girls and young women 15-24 years who had newly tested HIV positive from Nov 6, 2019, to Nov 22, 2021, consented and received recency tests. Most (2018;76%) were young women 20-24 years, and 450 (16.8%) were pregnant or breastfeeding. The median age of all was 21 years [Range; 15-24]. Of those who tested, 359 (13.4 %) were recent infections. Of these, the median age was 22 years [Range; 15-24], most (267;74.4%) were 20-24 years of age, and 92(25.6%) were 15-19 years. Additionally, 113(31.5%) were testing for the first time, and 47 (13.1%) were pregnant or breastfeeding (Table 3).
Table 3: Characteristics of Adolescent Girls and Young Women with long-term and recent HIV infections, Uganda, November 2019-November 2021
|
Variable |
Long term HIV infections n=2249 | Recent HIV Infections n=359 | ||
| n | (%) | n | (%) | |
| Age | ||||
| 15-19 | 525 | (23.3) | 92 | (25.6) |
| 20-24 | 1724 | (76.7) | 267 | (74.4) |
| First time HIV test | ||||
| Yes | 629 | (27.9) | 113 | (31.5) |
| Special category | ||||
| Pregnant or Breastfeeding | 403 | (17.9) | 47 | (13.1) |
| Fisherfolk | 43 | (1.9) | 7 | (1.9) |
| Migrant | 10 | (0.4) | 2 | (0.6) |
| Others | 1793 | (79.7) | 303 | (84.4) |
| Reasons for testing | ||||
| APN | 172 | (7.6) | 42 | (11.7) |
| Index testing | 40 | (1.8) | 7 | (1.9) |
| PMTCT | 491 | (21.8) | 65 | (18.1) |
| Self-Initiative | 710 | (31.6) | 119 | (33.1) |
| Self-testing | 33 | (1.5) | 5 | (1.4) |
| Others | 803 | (35.7) | 121 | (33.7) |
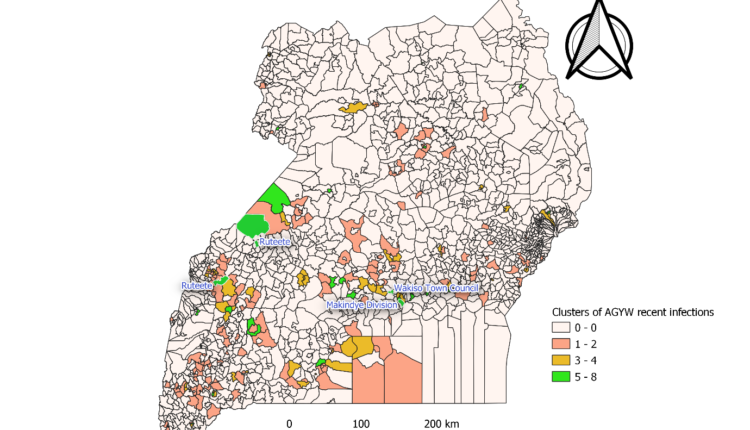
We further described recency data by place at sub-county levels. Sub-counties with five or more recent infections were mainly in Uganda’s western and central parts. We observed these clusters in Kyangwali sub-county in Kikube District, Ruteete sub-county in Kabarole District, Ruteete sub-county in Kagadi District, Kazo sub-county in Mbarara from the western region and Makindye division in Kampala District, Wakiso town council in Wakiso District from the Central region (Figure 5)
Discussion
Results from the analysis of DHIS2 data established a significant 5% decrease in HIV positivity among AGYW as HTS service uptake increased between January 2017 to December 2021. HIV positivity rate varied among age categories and districts. Nearly one in seven HIV infections (13.4%) was acquired recently among AGYW 15-24. We observed Variations of recent infections by age groups and sub-counties.
The decline in the HIV positivity rate could be due to the observed reduction in HIV prevalence among AGYW. According to the recent UPHIA 2020 results, HIV prevalence among AGYW 15-24 years declined from 3.3% in 2016 (4) to 2.9% in 2020 (16). Similarly, the national trend of HIV prevalence has been reducing over the last decade (5). We attribute this decline to the robust country-wide HIV prevention strategies, including the DREAMS program that targets HIV-negative AGYW girls to remain HIV negative, testing and treating all those HIV positive regardless of the CD4 count or WHO clinical stage, among others (17).
In addition, the decline could have also resulted from the effective HIV testing strategy as more AGYW accessed the HIV testing services. We established an increasing trend of HTS services, which was not affected during 2020-2021, the period of the COVID-19 pandemic. The high numbers tested during 2020 and 2021 differ from the known national decline in the HIV testing services in 2020 and 2021 due to COVID-19-related disruptions in the HIV testing and treatment services (18). Nevertheless, we observed a 24% drop in HTS services in 2019, a year with the highest HIV positivity rate.
We attribute the high positivity rate to the efficient, targeted testing approach implemented at that time that prioritizes individuals at high risk and increases yield, according to the AIDS control program Ministry of Health 2019 annual performance report (19). This highlights the need to scale up the targeted testing approach to reach as many AGYW at high risk of HIV to achieve epidemic control.
Our analysis found that the HIV positivity rate increased with age, which was consistent with the 2016 and 2020 UPHIA survey reports (4,16). Also, the HIV positivity rate was different among the different age categories, and these findings were comparable with UPHIA 2020 estimates; (15-19 years: 1.4 % vs 1.7% UPHIA 2020) and (20-24 years: 2.6 % vs 4.9% UPHIA 2020) (16). The difference in the burden of HIV among the different age groups was further confirmed by the recency testing data, as most AGYW who had recent infections were 20-24 years old. These variations in the age category HIV burden suggest the need for age-appropriate and explicit HIV prevention strategies targeted at specific drivers of HIV infections among adolescent girls and young women. Such strategies may include scaling up pre-exposure prophylaxis (PrEP), condom use, behavioural change communication, sexuality education and targeted HIV testing (4,10).
Despite the reduction in HIV positivity rate over the five years, districts of Mbarara, Sheema, Rwampala, and Kalangala had comparatively elevated rates. These observations aligned with the 2016 UPHIA findings whereby the central (8%) and southwestern (7.9%) regions had the highest HIV prevalence (20).
Elevated positivity rates in specific districts highlight the need to scale the DREAMS program to include the high HIV-burden districts where this program is not being implemented, mainly in Sheema and Rwampala districts.
Uganda is implementing the DREAMS program in only 44 districts due to limited funding; this leaves a gap for limited access to HIV prevention for all the girls in the country. Studies have shown this strategy effectively reduces new HIV infections among AGYW. For example, the DREAMS program reduced the incidence of HIV among AGYW in Lesotho by 71.4% in two piloted districts compared to a 48.4% decrease in those which didn’t have the program (21).
Nearly one in seven HIV infections (13.4%) AGYW was acquired recently among AGYW 15-24. This analysis provided a clue on estimated HIV incidence among AGYW, implying that there may be several AGYW with recent HIV infections still undiagnosed; this may fuel the HIV epidemic. In addition, the high proportion of recent HIV infections could be due to gaps in the effective implementation of strategies to stop HIV transmission and prevent new HIV infections among AGYW in some parts of the country (10).
Nevertheless, we found a more considerable proportion (84.6%) of AGYW had long-term infections suggesting that most AGYW live with undiagnosed HIV, which puts them a risk of severe disease and HIV-related deaths. Moreover, a sizeable proportion (31.5%) was tested for the first time, suggesting a gap in timely HTS services. Despite the supporting HIV testing policy whereby a 12-year-old can test for HIV without a parents’ consent, most are not utilizing the services (12). There is a need to scale up HIV testing services to reach out to undiagnosed HIV positive AGYW by strengthening mobile and self-testing HIV testing strategies, as these were found acceptable in a study done in Kenya (22).
Additionally, we observed clusters of recent HIV infections in Kyangwali and Ruteete sub-counties in Kabarole district, Ruteete sub-county in Kagadi district, and Kazo sub-county in Mbarara district in western Uganda, trading Centres of Wakiso, Makindye, and central divisions of Kampala metropolitan. These are likely to be hotspots for HIV transmission. For example, the Kyangwali sub-county in western Uganda is a refugee settlement (23). Being a refugee puts adolescent girls more vulnerable to sexual gender-based violence and limited access to HIV prevention services (24). Also, some of these sub-counties were located in districts with high HIV prevalence, like Kabarole and Mbarara (4).
Therefore, there is a need to strengthen HIV prevention interventions targeting the most affected districts and the hotspots for recent HIV infections. In addition, there is a need to investigate these clusters of recent infections to identify the risk factors and implement evidence-based prevention strategies.
Limitations
Our analysis was limited due to the aggregated data in the electronic HMIS system; we could not explore other variables. Also, there is a possibility of underreporting or double reporting of clients due to limitations of patient identification. Nevertheless, the variables obtained provided adequate information useful in targeted HIV prevention.
Conclusions
The HIV positivity rate among AGYW reduced significantly from 2017 to 2021. However, were found variations among the different age categories and specific districts. At least one in seven AGYW had recent HIV infections.
We observed clusters of recent HIV infections in specific sub-counties bordering the Democratic Republic of Congo (DRC), Western Uganda and Central Kampala. The Ministry of Health could initiate outbreak investigations in communities with clusters of recent HIV infections.
Additionally, MoH should consider strengthening the HIV prevention interventions among AGYW, which are age-specific in the most affected districts, and scale-up targeted HIV testing services to ensure early diagnosis and treatment of HIV positive AGYW.
Acknowledgments
We would like to thank the Ministry of Health Division of Health Information and the Monitoring and Evaluation Technical Support (METS) Program for permitting us to use these data
References
- Young people, HIV and AIDS [Internet]. Avert. 2015 [cited 2021 Apr 6]. Available from: https://www.avert.org/professionals/hiv-social-issues/key-affected-populations/young-people
- UNAIDS. Global HIV & AIDS statistics — Fact sheet [Internet]. 2022 [cited 2022 Apr 4]. Available from: https://www.unaids.org/en/resources/fact-sheet
- UNAIDS. UNAIDS HIV Prevention Among Adolescent Girls and Young Women | PDF | Hiv/Aids | Adolescence [Internet]. Scribd. 2022 [cited 2022 Apr 4]. Available from: https://www.scribd.com/document/543853218/UNAIDS-HIV-prevention-among-adolescent-girls-and-young-women
- Ministry of Health, Uganda. S. Uganda Population-based HIV Impact Assessment (UPHIA) 2016-2017: [Internet]. Uganda AIDS Commission. 2017 [cited 2022 Apr 4]. Available from: https://uac.go.ug/index.php
- Ministry of Health, Uganda. S. HIV Fact Sheet 2020 [Internet]. Uganda AIDS Commission. 2020 [cited 2022 Apr 4]. Available from: https://uac.go.ug/index.php
- HIV and AIDS [Internet]. [cited 2021 Oct 19]. Available from: https://www.unicef.org/uganda/what-we-do/hiv-aids
- UPHIA Uganda factsheet.pdf.
- HIV and AIDS in Uganda [Internet]. Avert. 2015 [cited 2021 Apr 1]. Available from: https://www.avert.org/professionals/hiv-around-world/sub-saharan-africa/uganda
- Uganda AIDS commission S. National HIV and AIDS Strategic Plan 2020/21 – 2024/25: Ending the HIV and AIDS epidemic: Communities at the forefront: Kampala: Uganda AIDS Commission; 2020. [Internet]. Uganda AIDS Commission. 2020 [cited 2022 Apr 4]. Available from: https://uac.go.ug/index.php
- DREAMS: Partnership to Reduce HIV/AIDS in Adolescent Girls and Young Women [Internet]. 2020 [cited 2021 Apr 6]. Available from: https://www.usaid.gov/global-health/health-areas/hiv-and-aids/technical-areas/dreams
- Ministry of Health, Uganda. List of Hospitals, Ministry of Health Uganda [Internet]. Ministry of Health | Government of Uganda. [cited 2022 Jun 15]. Available from: https://www.health.go.ug/hospitals/
- Ministry of Health, Uganda. S. National HIV Testing Services Policy and Implementation Guidelines Uganda | Ministry of Health Knowledge Management Portal [Internet]. 2010 [cited 2022 Apr 4]. Available from: http://library.health.go.ug/publications/hivaids/national-hiv-testing-services-policy-and-implementation-guidelines-uganda
- HIV Recency Testing in Uganda | Mets [Internet]. [cited 2022 Jan 1]. Available from: https://mets.or.ug/hiv-recency-testing-in-uganda/
- Disease Surveillance, UCSF team. HIV Recency Testing in Uganda | Mets [Internet]. 2019 [cited 2022 Jun 17]. Available from: https://mets.or.ug/hiv-recency-testing-in-uganda/
- Biosciences S. AsantéTM HIV-1 Rapid Recency® [Internet]. Sedia Biosciences. [cited 2022 Jun 14]. Available from: https://www.sediabio.com/asante-hiv-1-rapid-recency/
- Ministry of Health Uganda. Release of Preliminary Results of the 2020 Uganda Population-Based HIV Impact Assessment Uganda [Internet]. 2022 [cited 2022 Feb 25]. Available from: https://www.mediacentre.go.ug/media/release-preliminary-results-2020-uganda-population-based-hiv-impact-assessment
- Consolidated Guidelines for Prevention and Treatment of HIV in Uganda | Ministry of Health Knowledge Management Portal [Internet]. [cited 2022 Mar 18]. Available from: http://library.health.go.ug/publications/hivaids/consolidated-guidelines-prevention-and-treatment-hiv-uganda-1
- 2020 Uganda HIV -AIDS fact sheet, Sept 6 2021. pdf.
- Ministry of Health, Uganda. Annual Health Sector Performance Report Financial Year 2019/20 | Ministry of Health Knowledge Management Portal [Internet]. 2020 [cited 2022 Apr 4]. Available from: http://library.health.go.ug/publications/performance-management/annual-health-sector-performance-report-financial-year-201920
- UNAIDS. 2020 Uganda HIV -AIDS fact sheet, Sept 6 2021. pdf. 2020.
- Pelletier AR, Derado J, Maoela L, Lekhotsa T, Sechache M, Nkuatsana K. Impact of the DREAMS Program on New HIV Diagnoses in Adolescent Girls and Young Women Attending Antenatal Care — Lesotho, 2015–2020. MMWR Morb Mortal Wkly Rep. 2022 Jan 14;71(2):48–51.
- Wilson KS, Mugo C, Katz DA, Manyeki V, Mungwala C, Otiso L, et al. High Acceptance and Completion of HIV Self-testing Among Diverse Populations of Young People in Kenya Using a Community-Based Distribution Strategy. AIDS Behav. 2021 Sept 1;1–11.
- Kikuube Local Government. Kikuube District Population [Internet]. KIKUUBE DISTRICT LOCAL GOVERNMENT. [cited 2022 May 6]. Available from: https://kikuube.go.ug/
- CDC Immigrant and Refugee Health. Refugees HID and AIDS [Internet]. Refugee Health TA. [cited 2022 May 6]. Available from: https://refugeehealthta.org/physical-mental-health/health-conditions/infectious-diseases/hiv/
Comments are closed.