

National trends of vaccine wastage in Uganda, 2020–2025: A descriptive analysis of four tracer antigens
Sharon Namasambi1*, Richard Migisha1, Collins Ankunda2, Nasif Matovu1, Christine Lanyero3, Paul Sagyiri3, Emmanuel Okiror Okello1,3, Katongole Deogratius3, Patricia Eyu1, Benon Kwesiga1, Yasiini Nuwamanya3, Fred Nsubuga3, Institutional affiliations:1Uganda Public Health Fellowship Program, Uganda National Institute of Public Health, Kampala, Uganda, 2Department of Pharmacology and Therapeutics, Makerere University, Kampala, Uganda, 3Uganda National Expanded Program on Immunisation, Ministry of Health, Kampala, Uganda. *Correspondence: Email: nabsharon@uniph.go.ug, Telephone number: +256 772 511 067

Summary
Background: Vaccine wastage reduces immunisation efficiency, increases costs, and complicates supply forecasting. Uganda routinely monitors vaccine use, but national evidence comparing observed wastage with World Health Organization (WHO) and Uganda-specific planning thresholds has been limited We described national and sub-national trends for four tracer antigens between 2020–2025, to inform supply-chain planning and forecasting.
Methods: We conducted a retrospective descriptive analysis of routinely reported immunisation surveillance data from Uganda’s District Health Information Software 2, for 2020–2025. We analysed Bacille Calmette–Guérin (BCG), measles–rubella (MR), oral polio vaccine (OPV), and Diphtheria–Tetanus–Pertussis-containing vaccine (DPT) data. We analysed wastage at national and lower and higher health facility levels Lower-level facilities were defined as Health Centre (HC) II and HC III; higher-level as HC IV, general hospitals, and referral hospitals. Vaccine wastage was calculated as the proportion of issued doses not administered. Annual wastage rates were summarised using medians, and temporal trends were assessed using the Mann–Kendall test. Observed wastage was compared with WHO thresholds: BCG≤50%, MR≤25%, OPV≤10%, DPT≤15%, and Uganda’s planning thresholds: BCG≤70%, MR≤40%, OPV≤15%, DPT≤10%.
Results: During 2020–2025, median national wastage was 40.6% for BCG, 25.9% for MR, 10.0% for OPV, and 9.2% for DPT. OPV wastage declined from 12.8% in 2020 to 8.0% in 2025, with a significant downward trend (τb=−1.00; p=0.008). OPV and DPT wastage remained largely within their respective Uganda in-country thresholds (≤15% and ≤10%) for most of the study period, while BCG generally remained below the WHO threshold (≤50%) and MR frequently exceeded the WHO threshold (≤25%) but remained within Uganda’s planning threshold (≤40%) in most years. Wastage was consistently higher in lower-level (Health Centre II and III) facilities, compared to higher level facilities.
Conclusions: OPV demonstrated the only statistically significant downward wastage trend and, together with DPT, remained within acceptable thresholds for most of the study period. BCG showed substantial variability without a significant trend, while MR frequently exceeded the WHO threshold though remaining within Uganda’s national planning threshold in most years. Wastage was persistently higher at lower-level facilities across all four antigens. Strengthening session microplanning and multi-dose vial policy adherence at lower-level facilities, and revising quantification assumptions to reflect observed antigen-specific trends, could improve vaccine utilisation and supply forecasting.
Background
Vaccine wastage, doses issued but not administered, increases programme costs, reduces supply efficiency, and makes forecasting less accurate(1,2). Some wastage is inherent, particularly when vaccines are supplied in multi-dose vials and session attendance is low(3) . However, excessive wastage signals problems with session planning, stock management, cold-chain handling, or Multi-Dose Vial Policy (MDVP) compliance. The challenge is greatest for lyophilised vaccines such as Bacille Calmette–Guérin (BCG) and measles–rubella (MR), which must be discarded shortly after reconstitution, compared to preservative-containing liquid vaccines such as oral polio vaccine (OPV) and Diphtheria–Tetanus–Pertussis-containing vaccine (DPT), which can be retained for later use if MDVP conditions are met (3,4).
Uganda’s immunisation programme uses both World Health Organisation (WHO) global wastage thresholds and national planning thresholds for procurement and forecasting. Most previous Ugandan studies focused on selected districts or short observation periods, leaving national trends and threshold comparisons poorly characterised (5,6). We described national and sub-national trends for four tracer antigens to inform supply-chain planning and forecasting.
Methods
We conducted a retrospective descriptive analysis of routinely reported immunisation surveillance data extracted from DHIS2 for Uganda, covering January 2020 to December 2025. Four tracer antigens were selected: Bacille Calmette–Guérin (BCG-lyophilised, 20-dose vials), measles–rubella (MR-lyophilised, 10-dose vials), oral polio vaccine (OPV-liquid, 20-dose vials), and diphtheria–tetanus–pertussis-containing vaccine (DPT-liquid, 10-dose vials). We analysed wastage at national and lower and higher health facility levels. Lower-level facilities were defined as Health Centre (HC) II and HC III; higher-level as HC IV, general hospitals, and referral hospitals. Vaccine wastage was calculated as the proportion of issued doses not administered: Wastage Rate (%) = [(Doses issued − Doses administered) / Doses issued] × 100, where doses issued = (doses received + opening balance) − closing balance.
Observed wastage was compared against WHO thresholds (BCG ≤50%, MR ≤25%, OPV ≤10%, DPT ≤15%) and Uganda (National) planning thresholds (BCG ≤70%, MR ≤40%, OPV ≤15%, DPT ≤10%). Annual national wastage rates were summarised using medians, and temporal trends assessed using the Mann–Kendall test. Annual percentage change (APC) was calculated descriptively to characterise year-to-year variation. Approval to access and use DHIS2 and UNEPI supplementary data was obtained from the Ministry of Health (MOH). In addition, a non-research determination clearance was approved by the U.S. Centers for Disease Control and Prevention (CDC). The investigation was conducted in accordance with applicable U.S. federal regulations governing public health surveillance and data protection (see, for example, 45 C.F.R. part 46; 21 C.F.R. part 56; 42 U.S.C. §241(d); 5 U.S.C. §552a; 44 U.S.C. §3501 et seq.). As this analysis involved routine program and surveillance data and posed no more than minimal risk to participants, written informed consent was not required.
Results
Annual median vaccine wastage rates, Uganda, 2020-2025
Between 2020 and 2025, national BCG wastage had a median of 40.6% (IQR 39.9–44.6), generally below the WHO threshold ≤50% but with variability from 37.6% to 72.5%. Median wastage for MR was 25.9% (IQR 17.3–30.3), frequently exceeding the WHO threshold ≤25% but remaining within the national threshold ≤40% in most years. However, DPT median wastage was 9.2% (IQR 7.7–11.5) with moderate fluctuation, remaining within WHO and national acceptable thresholds. Similarly, OPV median wastage declined from 12.8% in 2020 to 8.0% in 2025, with low variability remaining within acceptable WHO and national thresholds (median 10.0%; IQR 9.4–10.7)
(Figure 1).
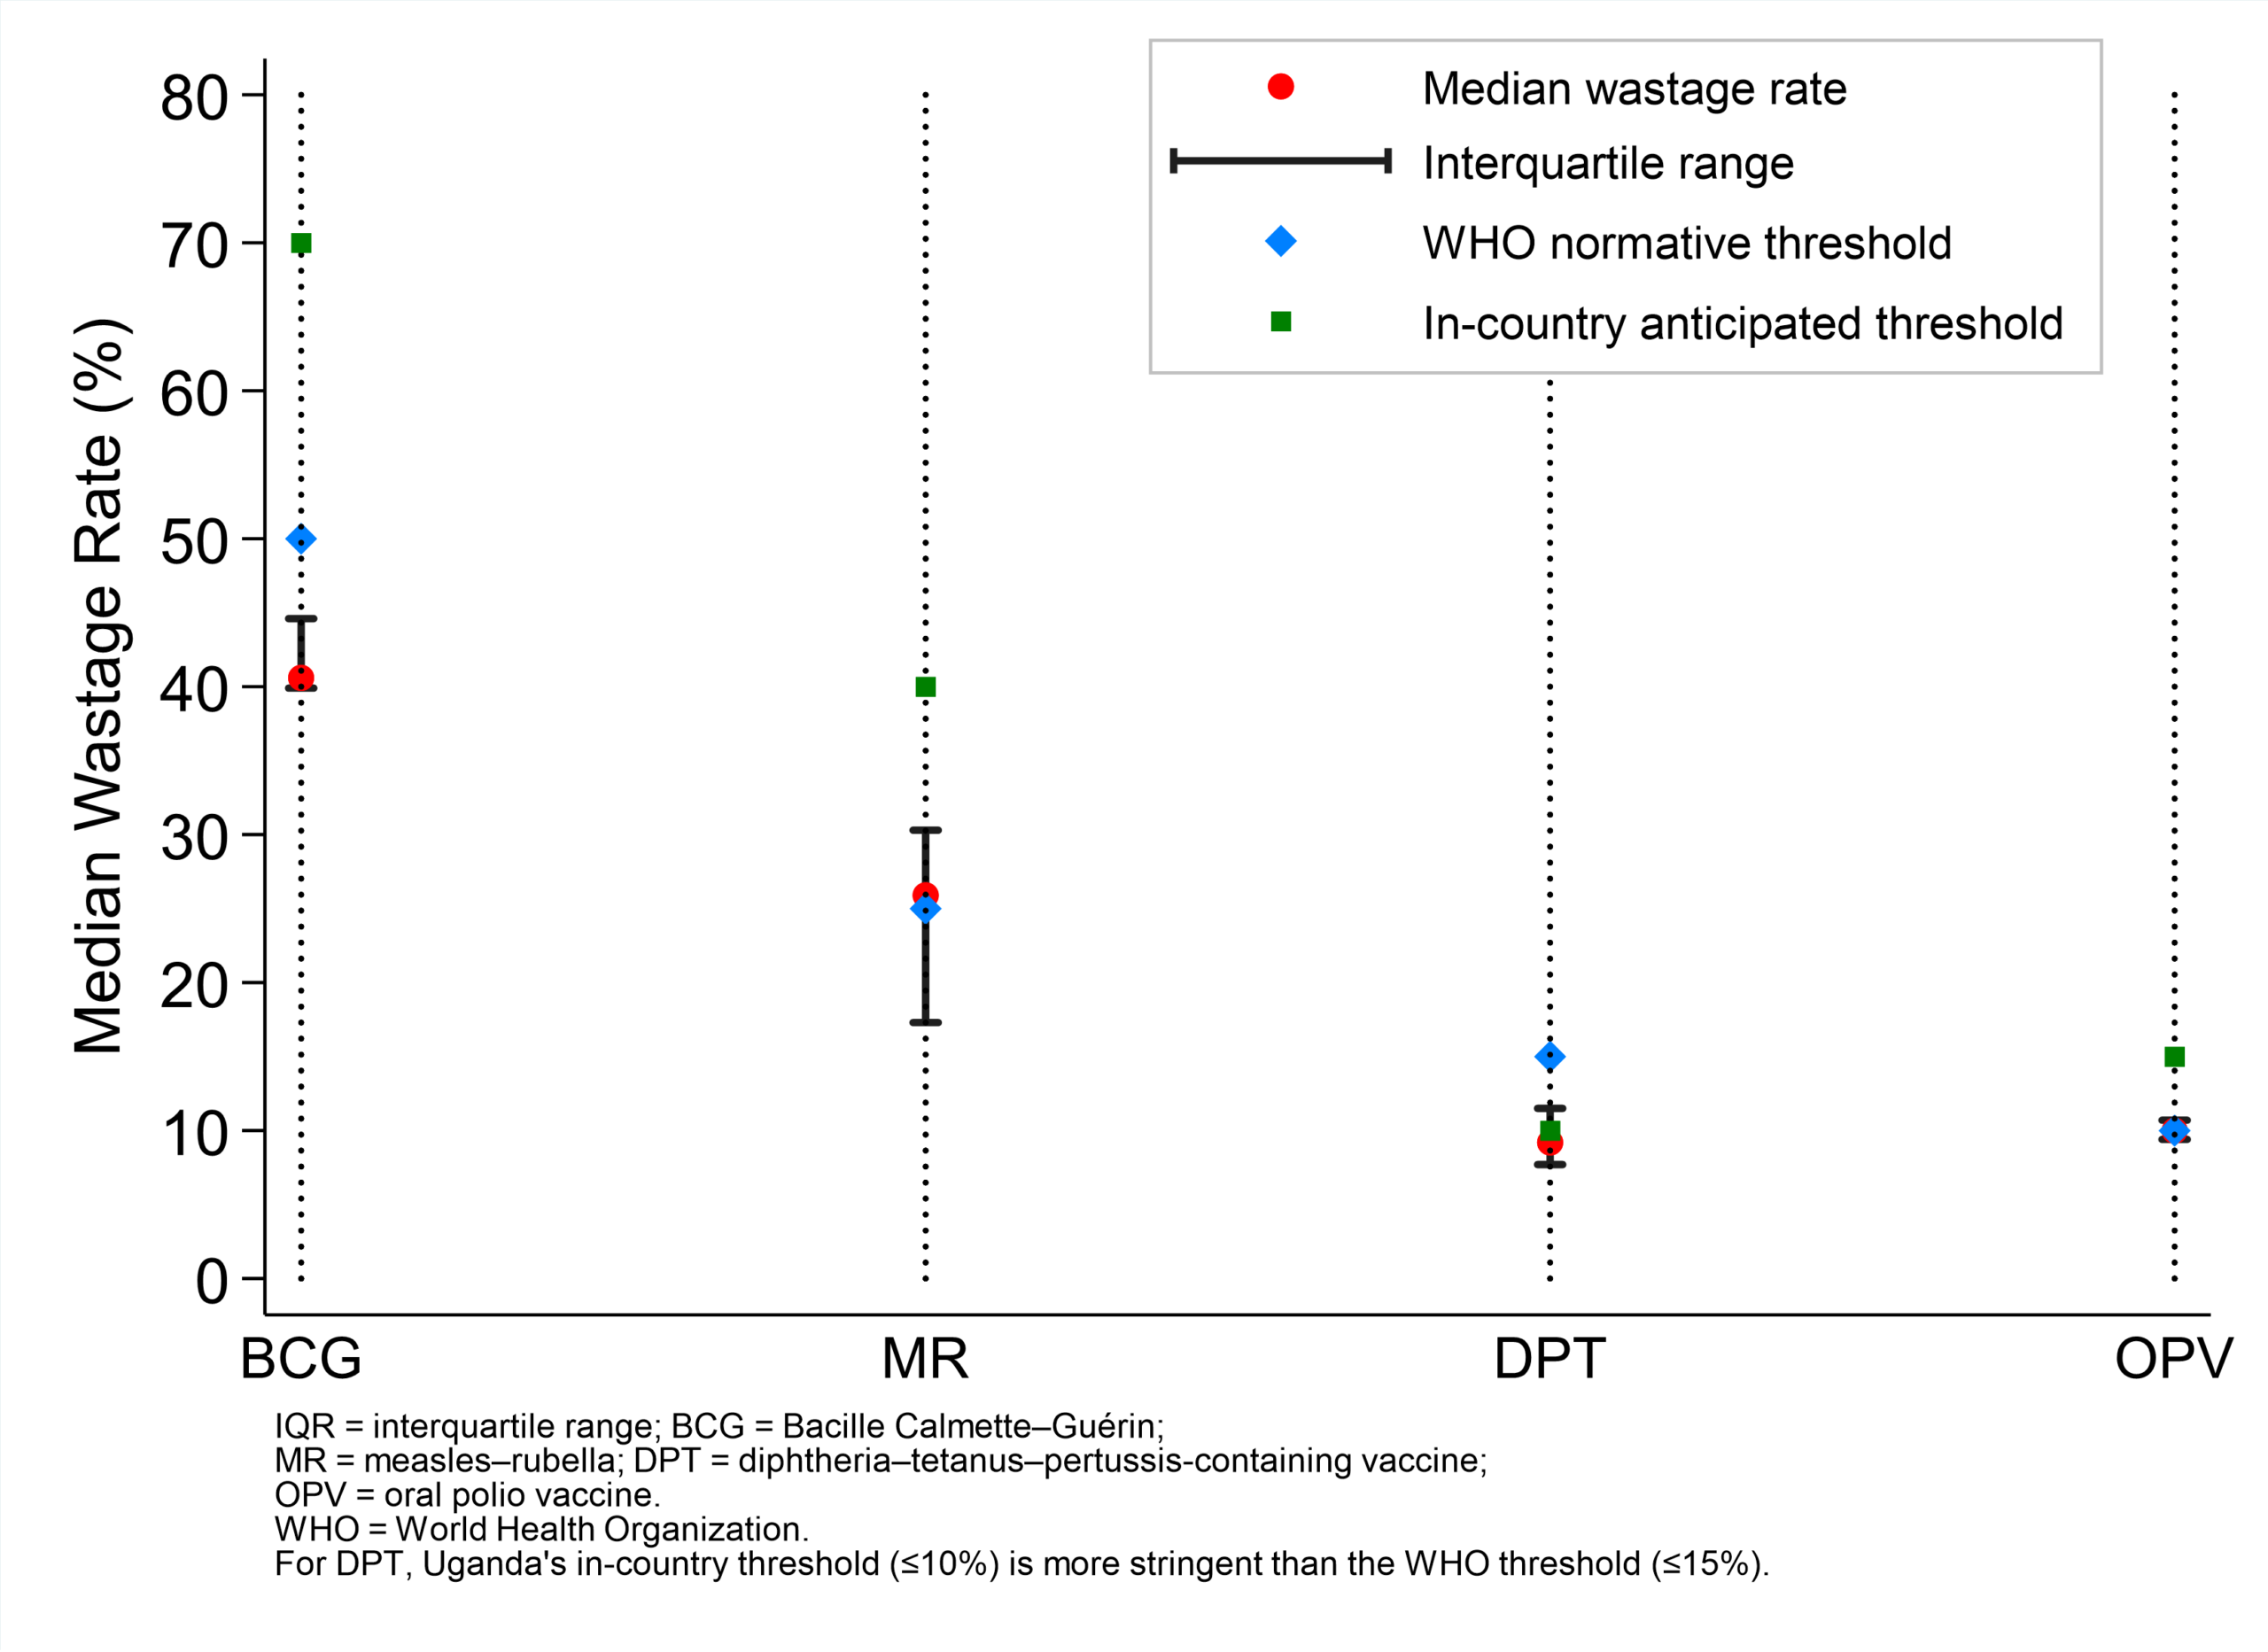
Temporal trends in national vaccine wastage of BCG, MR, DPT, and OPV vaccines in, Uganda, 2020–2025
BCG wastage fluctuated markedly, with a non-significant estimated annual increase of 4.1% (95% CI −13%-+21%; p=0.554), and no observed monotonic trend (τb=0.07; p=1.000); (Figure 2A). Similarly, MR wastage showed substantial year-to-year variation, with an estimated annual change of +0.9% (95% CI −36.7 to 38.6; p=0.95), and a non-significant monotonic trend (τb=−0.07; p=1.000); (Figure 2B). A pronounced increase in BCG and MR wastage observed during 2023–2024 coincide with major programmatic events, including large-scale catch-up vaccination activities and operational adjustments following the introduction of the second dose of measles–rubella vaccine (MR2). DPT wastage alternated across years, with the largest rise in 2023, before declining in 2024 and 2025; average annual reduction of −7.7% (p=0.52), with a moderate negative monotonic trend (τb=−0.60; p=0.13) that didn’t reach statistical significance; (Figure 2C). In contrast, OPV wastage declined steadily with an estimated significant annual reduction of −7.6% (p=0.002) fully supported by a significant downward trend (τb=−1.00; p=0.008); (Figure 2D).
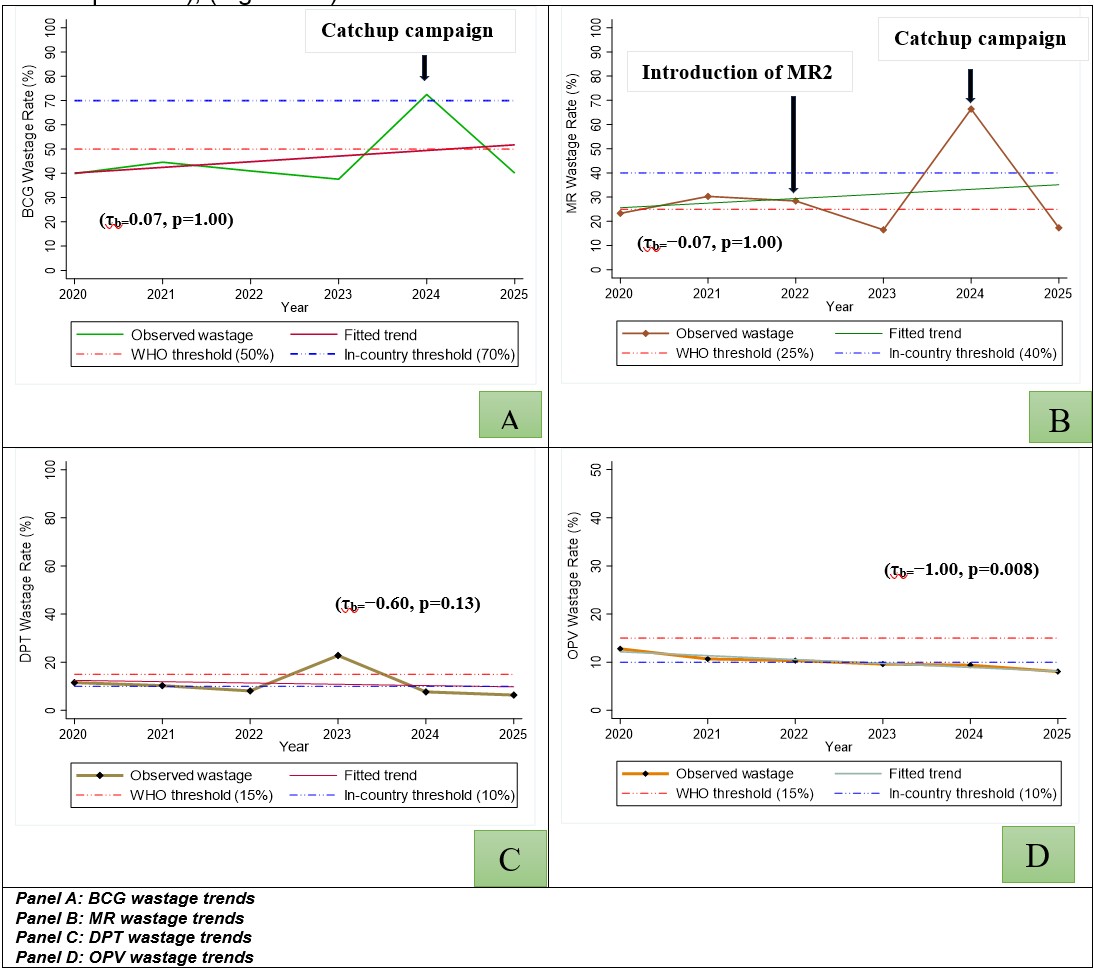
Vaccine wastage trends by antigen and health facility category, Uganda, 2020–2025
Wastage was consistently higher at lower-level than higher-level facilities for all four antigens throughout the study period. OPV wastage at lower-level facilities remained above the WHO threshold for most years despite a significant decline (22.0%-15.5%; APC −9.0%; p=0.019), while higher-level facilities maintained wastage below both thresholds (APC −20.9%; p=0.009). DPT wastage at lower-level facilities exceeded both thresholds for most years but declined from 18.1% to 13.5% (APC −5.9%; p=0.002).Wastage of MR vaccine at lower-level facilities fluctuated between 28.1% and 39.5% with no significant trend. BCG wastage at lower-level facilities approached or exceeded the WHO threshold in several years, peaking at 51.5% in 2024.
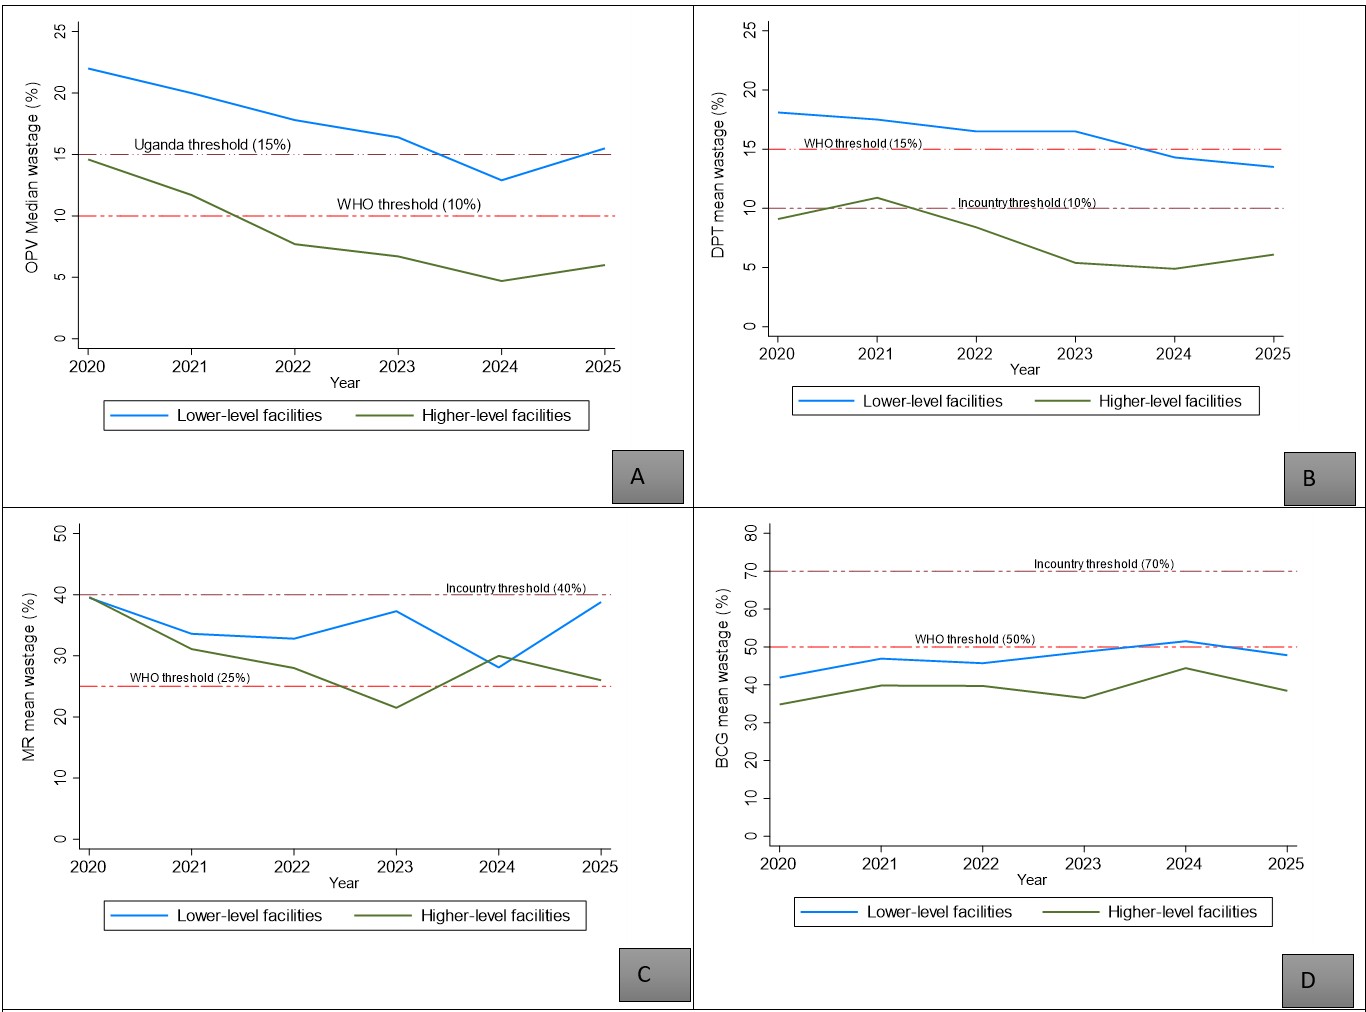
Discussion
Three patterns characterise vaccine wastage in Uganda during 2020–2025. First, wastage declined most for OPV, consistent with better utilisation of MDVP-eligible liquid vaccines whose open vials can be retained across sessions if labelling and cold-chain conditions are met. Second, BCG, and MR, both lyophilised vaccines requiring discard shortly after reconstitution, showed greater year-to-year variability and remained harder to optimise. Third, wastage was persistently higher at lower-level facilities, where smaller session sizes and less predictable attendance amplify open-vial losses.
The 2023–2024 spike in BCG and MR wastage, coinciding with catch-up campaigns and MR2 introduction, illustrates the programme’s vulnerability to operational shocks; campaign pre-positioning can result in under-attended sessions, and new vaccine introductions typically involve transitional wastage as quantification and demand-generation systems adjust (7–9) . The subsequent recovery in 2025 suggests system resilience but highlights the need for real-time monitoring to detect and correct abrupt deviations.
The facility-level gradient should not be interpreted solely as poor performance at lower levels. These facilities serve smaller catchment populations, conduct smaller sessions, and provide outreach services where attendance is less predictable(5,6,10,11).
A uniform national wastage target may therefore obscure important operational differences. For low-volume facilities, the realistic goal is reducing avoidable wastage while protecting access and timeliness. Piloting smaller vial presentations for BCG and MR at peripheral facilities, combined with session microplanning and demand aggregation, represents the most actionable approach to reducing open-vial losses at this level.
Study limitations
This analysis relied on routinely reported DHIS2 data, which may contain errors. Mitigation included range checks, consistency assessments, and triangulation with findings from the Effective Vaccine Monitoring reports. Annual aggregated data limited assessment of seasonal or session-level determinants. Unmeasured factors; supervision intensity, health worker turnover, and campaign activity, could confound observed trends.
Conclusion
Between 2020 and 2025, national vaccine wastage trends in Uganda diverged by antigen type and facility level. Oral Polio Vaccine was the only antigen that demonstrated a statistically significant downward and remaining within both WHO and Uganda planning thresholds for most of the study period. DPT similarly maintained low median wastage within acceptable thresholds, although its decline did not reach statistical significance. In contrast, BCG and MR, showed substantial year-to-year variability with no significant monotonic trends. BCG generally remained below the WHO threshold (≤50%), while MR frequently exceeded the WHO threshold (≤25%), though it remained within Uganda’s national planning threshold (≤40%) in most years. Wastage was consistently higher at lower-level facilities (HC II and HC III) across all four antigens throughout the study period. To reduce avoidable open-vial losses, priority actions include strengthening session microplanning and MDVP adherence at lower-level facilities, exploring smaller vial presentations for BCG and MR at peripheral sites, and updating vaccine quantification assumptions to reflect the structural facility-level gradient and the sustained decline in OPV wastage documented in this analysis.
Conflict of interest
The authors declare no competing interests
Acknowledgements
We acknowledge the Ministry of Health through the Uganda Expanded Program on Immunisation (UNEPI), and the Uganda Public Health Fellowship Program for their technical guidance and funding support.
Authors’ contributions
SN conceptualized the study, led data collection and analysis, and drafted the manuscript. CA, RM, PS YN, CL and EOO supported data analysis and technical review of the draft manuscript. CA, RM, LB and BK supported revision of the first manuscript draft. NM, YN, PS and FN contributed to tool development, and data quality assurance. CA, ARA and RM, provided technical input during the study design and data interpretation. All authors read and approved the final manuscript.
Copyright
All materials in the Uganda Public Health Bulletin are in the public domain and may be used and reprinted without permission; citation as to source, however, is appreciated. Any article can be reprinted or published. If cited as a reprint, it should be referenced in the original form.
References
- Sim SY, Watts E, Constenla D, Brenzel L, Patenaude BN. Return On Investment From Immunization Against 10 Pathogens In 94 Low- And Middle-Income Countries, 2011–30. Health Aff (Millwood). 2020 Aug;39(8):1343–53. doi:10.1377/hlthaff.2020.00103
- World Health Organisation. Immunization agenda 2030: A global strategy to leave no one behind. Immun Agenda 2030. 2024 Apr 8;42:S5–14. doi:10.1016/j.vaccine.2022.11.042
- World Health Organisation. Monitoring vaccine wastage at country level-Guidelines for program managers [Internet]. [cited 2025 Nov 13]. Available from: https://www.who.int/publications/i/item/WHO-VB-03-18-Rev-1
- World Health Organisation. WHO policy statement: Multi-dose vial policy (MDVP) – Handling of multi-dose vaccine vials after opening [Internet]. Geneva: WHO; 2014 [Internet]. 2014 [cited 2025 Nov 11]. Available from: https://www.who.int/publications/i/item/WHO-IVB-14.07
- Ninsiima M, Muhoozi M, Luzze H, Kasasa S. Vaccine wastage rates and attributed factors in rural and urban areas in Uganda: Case of Mukono and Kalungu districts. PLOS Glob Public Health. 2025 Jun 10;5(6):e0003745. doi:10.1371/journal.pgph.0003745
- Kemigisha M, Migisha R, Kyamwanga IT. Assessment of vaccine wastage and associated factors in Rukungiri District, Southwestern Uganda, 2018–2019: a mixed-methods study. 2024.
- Mvundura M, Lorenson K, Chweya A, Kigadye R, Bartholomew K, Makame M, et al. Estimating the costs of the vaccine supply chain and service delivery for selected districts in Kenya and Tanzania. Vaccine. 2015 May 28;33(23):2697–703. doi:10.1016/j.vaccine.2015.03.084
- Mvundura M, Ng J, Reynolds K, Theng Ng Y, Bawa J, Bambo M, et al. Vaccine wastage in Ghana, Mozambique, and Pakistan: An assessment of wastage rates for four vaccines and the context, causes, drivers, and knowledge, attitudes and practices for vaccine wastage. Vaccine. 2023 Jun 23;41(28):4158–69. doi:10.1016/j.vaccine.2023.05.033
- Bawa S, Shuaib F, Saidu M, Ningi A, Abdullahi S, Abba B, et al. Conduct of vaccination in hard-to-reach areas to address potential polio reservoir areas, 2014–2015. BMC Public Health. 2018 Dec 13;18(Suppl 4):1312. doi:10.1186/s12889-018-6194-y PubMed PMID: 30541501; PubMed Central PMCID: PMC6291919.
- Radwan NF, Abu-Sheasha GA, Bedwani RN, Yassine OG. Vaccine wastage and cost saving after multi-dose vial policy implementation in Egypt: A success story. Vaccine. 2021 Dec 17;39(51):7457–63. doi:10.1016/j.vaccine.2021.10.067
- Parmar D, Baruwa EM, Zuber P, Kone S. Impact of wastage on single and multi-dose vaccine vials: Implications for introducing pneumococcal vaccines in developing countries. Hum Vaccin. 2010 Mar;6(3):270–8. doi:10.4161/hv.6.3.10397

Comments are closed.