
Using the BABIES Matrix to Determine Patterns of New- born Birth Outcomes, Naguru Regional Referral Hospital, Kampala, Uganda, Nov 2018 – March 2019
Authors: Maureen Katusiime1, Frank Kaharuza2, Livingstone Makanga3, John Kamulegeya1, Benon Kwesiga1, John Wanyama4, Dinah Nakiganda3, Alex Riolexus Ario1 | Affiliations: 1Uganda Public Health Fellowship Program, Ministry of Health, Kampala Uganda, 2United States Agency for International Development, Kampala, Uganda, 3Reproductive Health Division, Ministry of Health, Kampala, Uganda, 4Naguru Regional Referral Hospital, Kampala, Uganda,
Summary
Uganda experiences high rates of perinatal mortality (PMR) (national PMR: 38/1,000 births), with most deaths occurring at or soon after birth. The BABIES matrix (Birthweight Age at Death Boxes for Intervention and Evaluation System) is a tool for data organization and analysis introduced in Western Uganda in 2014 to monitor and improve newborn outcomes data. We used the BABIES Matrix to determine the PMR in Naguru Regional Referral Hospital (NRRH), identify gaps in obstetric service quality, and recommend evidence-based improvement measures. We abstracted data from maternity registers at NRRH from November 2018-March 2019 and used it to fill the BABIES Matrix. We computed PMR by birthweight group, stage during pregnancy/birth/ neonatal period when the death occurred, maternal age, referral status, and mode of delivery.
We found 4,122 total births, 3,890 (94.4%) were alive at discharge, 54 (1.3%) were missing outcomes; overall PMR at NRRH was 43/1,000 births. Among 169 stillborn (rate: 41/1,000 births), 93 (55%) were fresh still births while 76 (45%) were macerated. Birthweight-specific PMR was highest among newborns <1500g (433/1,000 births), followed by 1500- 2499g (199/1,000 births), and ≥2500g (18/1,000 births). Maternal age was unassociated with PMR. Referred mothers had a higher PMR than walk-in mothers (87 vs. 39/1,000 births, p<0.001), while vaginal births had a higher PMR than cesarean section births (49 vs. 28/1,000, p=0.002). We concluded that PMR at NRRH was higher than the national PMR. The reasons for this are unclear but may relate to the quality of obstetric and newborn care provided or potentially late presentation to NRRH or the hospital receives mostly high risk women in labour compared to other facilities. We recommended the need for a detailed investigation on factors associated with the high PMR at NRRH to help under- stand the causes of this elevated PMR and hence guide development of targeted interventions to reduce these deaths.
Introduction
Globally 8.2 million children under five die each year with 1.2 million of these deaths occurring in sub-Sahara Africa alone (1, 2) . Approximately 3.3 million of these deaths take place within the first four weeks of life (1). Improving maternal, fetal, and newborn health is one of the major public health concerns for developing countries. Uganda experiences high rates of perinatal mortality (PMR) (national PMR: 38/1,000 births), with most deaths occurring at or soon after birth (3). Nevertheless, two thirds of these deaths can be prevented if the right effective health measures are provided at the right time, in the right place, by the right person, and in the right way (5 rights), for both the mother and baby. It is also the right of the mother and newborn to have that system in place.
BABIES matrix (Birth weight Age at death boxes for Intervention and Evaluation System) is a method of data organization and analysis that accounts for mothers’ and newborns’ outcomes (4). It is designed for use in low income settings and was introduced in Western Uganda in 2014 to monitor and improve newborn outcomes data and guide targeted interventions. It uses a standardized table where minimum data on birth weight, out- come (alive or dead) and perinatal period of death (antepartum, intrapartum, postpartum/neonatal) is collected (4). Data collected allows decision makers to estimate major contributors to maternal and perinatal deaths (4).
Health facilities in Uganda weigh and record birth weight in the Health Management Information System (HMIS) registers at facility level. However, this data has not been comprehensively used to assess the performance of the health system both at facility and at national level. Moreover, the District Health Information Software (DHIS2) reports aggregated data rather than individualized which compromises the linkage between individualized birth weight and birth out- comes. Furthermore, there is scanty information at facility and national level on the use of BABIES to evaluate the performance of the health system. Yet having a continuous evaluation of surveillance data is essential to monitor maternal, fetal and newborn outcomes. Having accurate and up to date information on the number of perinatal deaths including stillbirths that occur, where and when they occur (Macerated Still Births (MSB) or Fresh Still Births (FSB)), and on the cause of and factors contributing to stillbirth is critical for successful interventions (5). We therefore used the BABIES Matrix to determine the magnitude of PMR in Naguru Regional Referral Hospital, identify gaps in obstetric service quality, and recommend evidence-based improvement measures.
Methods
We conducted a descriptive cross sectional analysis of surveillance data on newborn birth outcomes for the period November 2018 to March 2019 at Naguru RRH. Naguru RRH is located in Nakawa Division, Kampala District. We held discussions with facility staff and profiled pregnant women who visited the hospital into those that had complications vs. those that did not have complications which in- formed development of the tick table. We abstracted data from the maternity registers using the tick table (an adaptable assessment tool that allows one to collect, organize, analyze, and translate data into information for decision making). We cross-tabulated age at death categories (columns) and birth weight groups (rows) to form a matrix where each death (count) was plotted in the appropriate cell. We added the alive column to facilitate the count, divide and compare process during analysis (6).
We computed PMR by birthweight group (≤1500g, 1500-2449g, ≥2500g), time period at death (during pregnancy/MSB, labour /FSB, neonatal deaths within first 24 hours), maternal age (≥20yrs vs. <20yrs), referral status (walk in/no referral vs. referral), mode of de- livery (vaginal vs. caesarean section) and LBW rate as the number of low birthweight births <2500g per 100 live births (7). Birth weight specific PMR (BWSPMR) was calculated by dividing the number of perinatal deaths among newborns of predetermined birthweight group by the total number of births in that weight group and Birth weight proportionate PMR (BWPPMR) was calculated by dividing the number of perinatal deaths among newborns of predetermined birth weight group by the total births (4).
Results
BABIES Count Table and Distribution of Perinatal Deaths at NRRH, November 2018-March 2019 Of 4,122 total births, 3,890 (94.4%) were alive at discharge, 178 (4.3%) were perinatal deaths (rate 43/1,000 births), and 54 (1.3%) were missing outcomes. One hundred sixty-nine newborns were stillborn (rate: 41/1,000 births); FSBs 93 (55%) were more than MSBs 76 (45%, p=0.06). Early neonatal mortality rate in the first 24 hours was (9/4122) 2/1,000 births (Table 1).
The BWPPMR was highest among newborns ≥2500g (16.0/1,000 births), followed by 1500-2499g (11.6/1,000 births), and <1500g (7.0/1,000 births) (Table 1).
LBW rate was 229/3899 (5.9%) among live births and 308/4122 (7.5%) among total births. Majority 91.4% (3564/3899) of live births had normal birth weight. More than half 31/54(57.4%) of missing birth outcomes had missing birth weights (Table 1)..
Distribution of PMR by Birth Weight Category and Maternal Status
The BWSPMR was highest among newborns <1500g (433/1,000 births), followed by 1500-2499g (199/1,000 births), and >2500g (18/1,000 births). Maternal age was unassociated with PMR; PMR was similar among mothers aged ≥20 years and those aged <20 (43/1,000 births, p=0.8). Referred mothers had a higher PMR than walk-in mothers (87 vs. 39/1,000 births, p<0.001), while vaginal births had a higher PMR than cesarean section births (49 vs. 28/1,000, p=0.002).
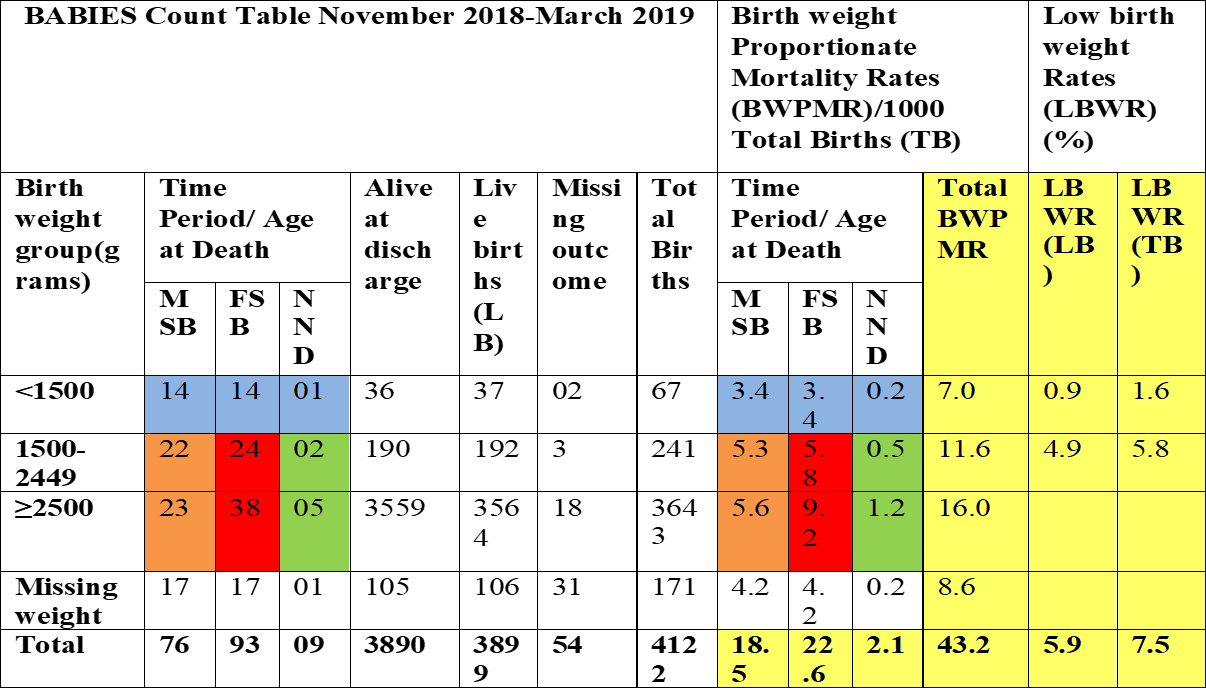
Table 1: BABIES Count Table; Distribution of Birth outcomes by Birth weight and Low birth Weight Rates at NRRH, Nov 2018-March 2019.
Discussion
Our analysis on using the BABIES matrix to determine patterns of newborn birth outcomes at NRRH for the period November 2018 to march 2019 highlights a high PMR than the national rate of 38/1000 births (3). This finding is consistent with results from a study conducted in Kabul, Afghanistan in four government hospitals with maternity services which had a PMR of 43.5/1000 births (8). Furthermore, our findings showed high PMR across all women groups; walk in vs. referred, vaginal deliveries vs. cesarean section deliveries, mothers of all age groups. Reasons for this are unclear but may relate to the quality of obstetric and newborn care provided or potentially late presentation to NRRH or this facility receives high risk women categories being a referral facility compared to other facilities. These findings show the need for a more detailed study to identify factors associated with the high PMR among pregnant women visiting NRRH for delivery to help understand the causes of this elevated PMR and hence guide development of targeted interventions to reduce these deaths.
Our study also revealed that over half of the still births in our study were FSBs/intrapartum deaths compared to MSBs/antepartum deaths similar to the World Health Organization estimates (WHO) 2019 which highlight that half of the still births in low and middle income countries occur during labour and birth (9). This finding further shows a possible gap in the quality of care and management provided to women during labour once admitted at this hospital. It also highlights the need for more interventions to focus on women during pregnancy and child birth.
Our study found high BWSPMR across all weight groups which is similar to findings of another study conducted at a women’s hospital in Afghanistan (4). BWSPMR measures if we are doing things correctly. Hence indicates a possibility of not implementing interventions correctly at NRRH. Another possible explanation could be that women present late in labour at NRRH or that the hospital is only receives very high risk pregnancies compared to other facilities. However, this indicator is more informative if tracked over time to determine if implemented interventions are having desired effect in reducing mortality.
A high proportion of missing birth outcomes and missing birth weights in our analysis shows an issue of under-registration of birth outcomes and not weighing newborns hence leading to underreporting of birth outcomes. Our finding is similar to a high under- registration rate of neonatal deaths found in Chile 30 years ago and other developing countries that lack complete information on birth weight (10) and underreporting (11). Results from the Chile study informed the startup of numerous policies and practices aimed at eliminating non-registration of live births and neonatal deaths which can be emulated by the Naguru RRH and at country level to boost vital statistics registration efforts currently going on in the country (10).Our study also emphasizes the importance of organizing outcome data by birth weight groupings and age at death in a simple way to get indicators of underlying causes and to identify types of prevention interventions that can be considered for implementation (12)
Limitations
Our study was conducted in one hospital, and findings may not be generalized to the entire country due to the limited geographical scope. However, NRRH is a regional referral hospital that receives pregnant mothers from different locations across the country hence enriching the findings. We used secondary data using BABIES matrix which was not specifically collected for this study. This data might have had limitations such as incompleteness especially in tracking an admitted mother from admission to discharge after delivery. Hence, our results may be an underestimation or overestimation of the problem faced at NRRH. Determining the actual time of death especially monitoring the fetal heart rate and or condition is generally poorly performed during pregnancy and at the time of birth. Therefore obtaining accurate data on when fetal death occurred is often difficult. Hence contributing to misclassification of some of the fetal deaths (11).
Conclusion and Recommendation
PMR at NRRH was above the national rate. PMR was highest among newborns <1500g, suggesting poor maternal health in the area, while the high stillbirth rate indicates opportunities for improvements in maternal health and care. The high PMR may also relate to the quality of care or late presentation to NRRH. We recommended a detailed investigation into factors associated with the high PMR at NRRH to guide development of targeted interventions to reduce these deaths.
References
- Matthews Z. World health report 2005: make every mother and child count. World Health. 2005;33:409–11.
- Lawn JE, Kerber K, Enweronu-Laryea C, Massee Bateman O. Newborn survival in low resource settings–are we delivering? BJOG. 2009;116 Suppl:49–59.
- Uganda Bureau of Statistics (UBOS) and ICF. 2018. Uganda De- mographic and Health Survey 2016. Kampala, Uganda and Rock- ville, Maryland, USA: UBOS and ICF.
- Dott M.M., Orakail N., Ebadi H., Hernandez. F., MacFarlane. K., Riley. P.L., Prepas.R., McCarthy. B.J (2006) Implementing a Fa- cility Based Maternal and Perinatal Health Care Surveillance System in Afghanistan. Vol50, No 4, July/August 2005. Doi:10.1016.2005.02.013
- World Health Organization (2002) The Health Newborn Manu- al: A Reference Manual for Program Managers. WHO Collabo- rating Center in Reproductive Health https://stacks.cdc.gov/ view/cdc/6506 (18)30565-5.
- World Health Organization (2006) Neonatal and Perinatal Mortality: Country, Regional and Global Estimates.
Comments are closed.