
Trends and distribution of hypertension in Uganda, 2016-2021
Authors: Thomas Kiggundu1*, Sarah Zalwango2, Richard Migisha1, Daniel Kadobera1, Alex Ario Riolexus1 Institutional affiliation: 1Uganda Public Health Fellowship Program-Uganda National Institute of Public Health, Kampala, Uganda, 2Kampala Capital City Authority, Kampala, Uganda, 3Centers for Disease Control and Prevention, Kampala, Uganda *Correspondence: Tel: +256752457453, Email: tkiggundu@musph.ac.ug/tkiggundu@uniph.go.ug
Summary
Background: Hypertension increases the risk of both cardiovascular and cerebrovascular diseases, leading to the premature death of an estimated 9.4 million persons per year worldwide. The overall prevalence of hypertension among adults in Uganda increased from 24.3% in 2014 to 31.5% in 2016. Public health interventions such as the introduction of walkways and cycling lanes, promotion of consumption of healthy foods, cessation of smoking, and promotion of health seeking have been made towards reducing hypertension in Uganda through the Ministry of Health (MoH). We described the distribution and trends of hypertension in Uganda, 2016-2021 to gauge the impact of the instituted control measures.
Methods: We conducted a descriptive analysis of out-patient department (OPD) national, regional, and district-level aggregated surveillance data on hypertension abstracted from the District Health Information System (DHIS2). As per DHIS2, hypertension was defined as a blood pressure ≥ 140/90 millimetres of Mercury. We abstracted and analyzed the data using MS Excel and STATA. We calculated prevalence by dividing the number of cases with reported hypertension by the total number of outpatients attended to per 1,000 population. We used the Mann-Kendall Trend test to assess trends of hypertension, January 2016-December 2021. We described the spatial distribution of hypertension by region.
Results: Overall, a total of 3,534,001(average: 589,000) cases of hypertension were recorded during 2016-2021. There was an increasing trend in the prevalence of hypertension from 2016 to 2021 across Uganda (MK=13, p=0.02). Over the analysis period, both the Western Region (MK=13, p=0.02) and the Central Region (MK=13, p=0.02) had an increasing trend in the prevalence of hypertension. There was no observable trend in both the Northern and Eastern Regions.
Conclusion: There was an increasing trend of hypertension in Uganda. There is a need to study the associated factors and formulate new strategies to mitigate the increasing burden.
Introduction
Hypertension is a major risk factor for cardiovascular and cerebrovascular diseases, leading to the premature death of an estimated 9.4 million people annually. The World Health Organization (WHO) estimates about 22% of the population aged ≥18 years have hypertension [1-4].
Approximately 75% of the world’s hypertensive population lives in low-income and middle-income countries (LMICs). The prevalence of hypertension in LMICs increased by 7.7% between 2000 and 2010 which presents a major concern [5]. The prevalence of hypertension is highest in the African region, with about 46% compared to 35% in the Americas, and 40% elsewhere in the world. Sub-Saharan Africa (SSA) contributes more than half (27.4%) of the African population affected [2, 5].
In 2019, the global prevalence of hypertension was stable with a decreased net effect in high-income countries and an increase in some low-income and middle-income countries. However, the prevalence increased in most low-income and middle-income countries. Hypertension prevalence was highest throughout central and eastern Europe, central Asia, Oceania, southern Africa, and some countries in Latin America and the Caribbean [6].
In Uganda, the most recent data on hypertension among adults was from the Uganda 2014 STEPwise approach to non-communicable disease risk factor surveillance (STEPS) survey [7] and national epidemiological study conducted in 2016 by Lunyera et al [8] showed the overall prevalence at 24.3% and 31.5% respectively. Notably, this STEPS survey recommended public health interventions to curb the prevalence of hypertension in Uganda. Public health interventions such as the introduction of walkways and cycling lanes, promotion of consumption of healthy foods, cessation of smoking, and promotion of health seeking have been made towards reducing hypertension in Uganda through the Ministry of Health (MoH). Despite these efforts to reduce the burden of hypertension, their impact has not been measured. We described the distribution and trends of hypertension in Uganda, 2016-2021 to gauge the impact of the instituted control measures.
Methods
Study setting, design, and data source
We conducted a descriptive analysis of out-patient department (OPD) national, regional, and district-level aggregated surveillance data on hypertension abstracted from the District Health Information System (DHIS2), 2016-2021. Uganda is located in the East African region with approximately 46 million people and 45% of this population being adults aged ≥18 years. It is divided in 15 administrative regions currently but were previously 4 namely: Northern, Western, Central, and Eastern Regions covering 136 districts with Kampala District as the capital. Uganda is a developing country with 75% of its population staying in rural areas. However, the urban population has increased over the last five years at a rate of approximately 6%. Hypertension-related services that include screening and management are provided from Sub-county level where health centre IVs are located to tertiary health facilities located at district, regional, and national levels. Screening of hypertension is not available at health facilities lower than health centre IV.
The DHIS2 is an open-source web based platform that is used to collect, report, and analyze aggregate data that is routinely generated across health facilities in Uganda. Uganda has 136 districts, which are distributed, across the 15 regions as designated by the Ministry of Health. The healthcare system comprises government and privately owned health facilities which are organized in a hierarchical order from Health Centre (HC) II (found at parish level), HCIII (found at county level/sub-district), HCIV (found at county/health sub-district level), district hospital (found at district level), regional referral hospital found at regional level), and the national referral hospital (found at national level). The DHIS2 collects data on priority diseases, conditions, and events of public health importance including hypertension from the Health Management Information system (HMIS). The HMIS is a paper-based system in which health facilities record patient data on conditions of interest. These data are later entered into the electronic DHIS2 and aggregated from all health centres in the country.
Study variables, data abstraction, management, and analysis
We abstracted data regarding adult OPD attendance, hypertension status, reporting rate, at district, region, and national level for the years (2016-2021). Data were cleaned using MS Excel and imported into STATA version 16 software for analysis. We calculated the prevalence of hypertension per 1,000 OPD attendance. OPD attendance data was obtained from the monthly outpatient report Health management information system (HMIS) form 105. We calculated prevalence of hypertension at national, region, and district level. The prevalence of hypertension was calculated as the number of cases with reported hypertension divided by the total number of outpatients attended to. We demonstrated the trends of hypertension using line graphs. We used the Mann-Kendall Trend test to assess trends of hypertension from January 2016 to December 2021. Choropleth maps were drawn using QGIS software to show the spatial distribution of hypertension prevalence in the country. To further contextualize the findings, we also abstracted data on reporting rates, calculated as the percentage of complete submitted monthly reports over the study period divided by the number of expected reports.
Ethical consideration
The DHIS2 data are aggregated without individual identifiers. We sought permission to use the data from the Uganda Ministry of Health. This activity was reviewed by US CDC and was conducted consistent with applicable federal law and CDC policy. § §See e.g., 45 C.F.R. part 46, 21 C.F.R. part 56; 42 U.S.C. §241(d); 5 U.S.C. §552a; 44 U.S.C. §3501 et seq. The office of the Center for Global Health, US Center for Disease Control and Prevention determined that this activity was not human subject research and with its primary intent being for public health practice or disease control.
Results
Reporting rates and overall prevalence of hypertension, Uganda, 2016-2021
During the analysis period (2016-2021), reporting rates for hypertension increased from 73% to 98%. There was a national overall increase in the prevalence of hypertension of 12% (MK=13, p=0.02). The greatest increase was between 2017 and 2018 (Figure 1).
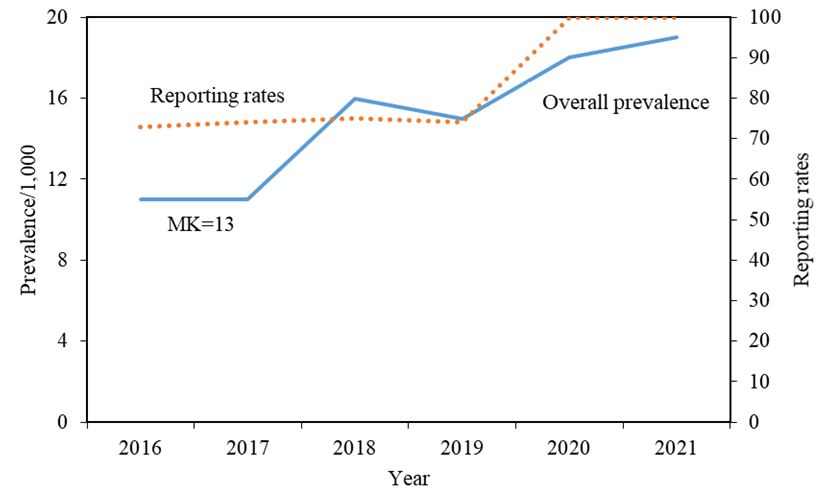
The overall prevalence of hypertension increased significantly from 11 per 1000 in 2016 to 19 per 1,000 in 2021(MK=13, p=0.02) with a 13% annual increase (Figure 1 and Table 1).
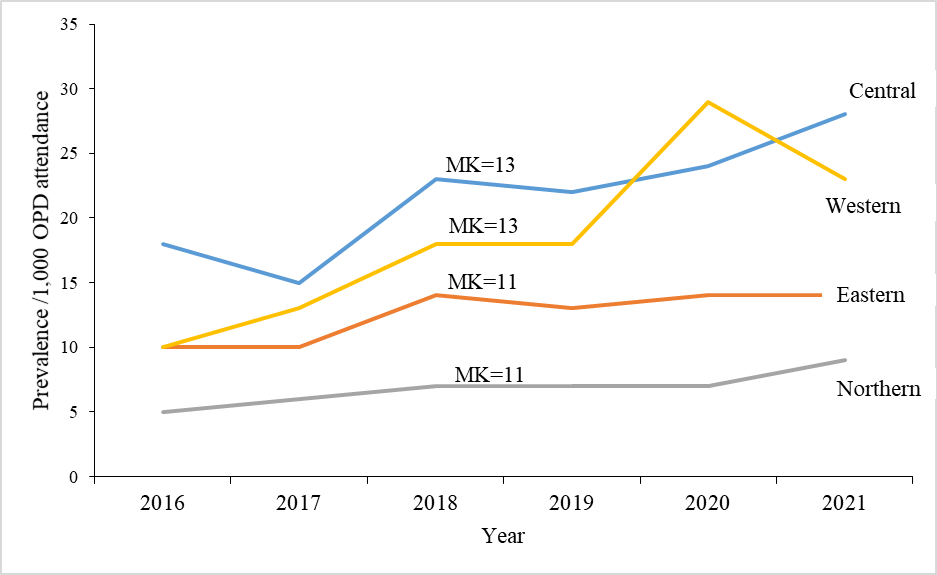
Prevalence of hypertension per 1,000 Out Patient Department attendance, Uganda, by regions, 2016-2021
From 2016-2021, Western Region and Central Region had an increasing trend in the prevalence of hypertension (MK=13, p=0.02) while Eastern Region and Northern had no observable positive trend (Table 1 and Figure 2).
Table 1: Percentage of overall national and regional increase of hypertension, Uganda, 2016-2021
| Region | Overall prevalence/1,000 | Kendall’s score/p-value |
| Western | 19 | 13 (0.02)* |
| Northern | 12 | 11 (0.06) |
| Central | 11 | 13 (0.02)* |
| Eastern | 7 | 11 (0.06) |
| National | 12 | 13 (0.02)* |
*p<0.05
Distribution of prevalence of hypertension, Uganda, by district level, 2016-2021
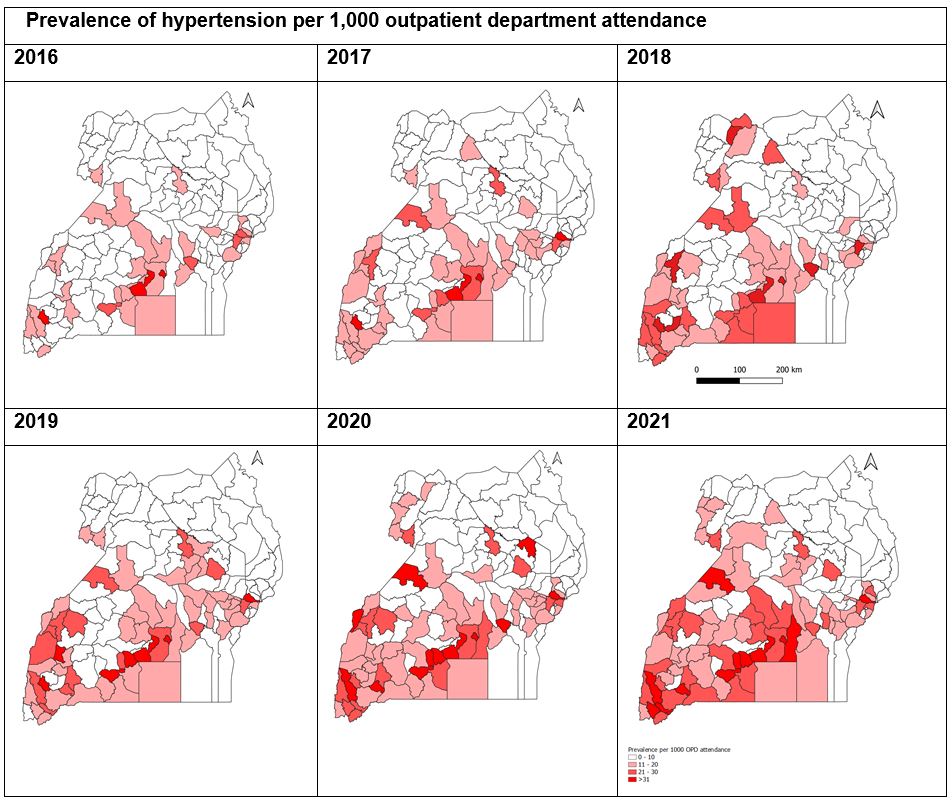
In 2016, only two regions, central (Kampala and Mpigi), and western (Mitooma) had districts with a prevalence of hypertension above 30 per 1,000 OPD attendance (Figure 3). By 2021, there were more districts and more regions namely; the western (Rukigi, Rukungiri, Hoima, and Rubanda) and central regions (Kampala, Mpigi, Lwengo, Kalungu, Mukono, Lwengo, and Bukomansimbi) with one district in the eastern region (Sironko) which had registered increasing trends in hypertension (Figure 3).
Discussion
We sought to determine the trends and distribution of hypertension in Uganda, 2016 to 2021. We found a rise in the prevalence of hypertension from 11 per 1,000 to 19 per 1,000 OPD attendance with an overall rise in the prevalence of hypertension of 12%. Similarly, all regions had increases in the incidence of hypertension with the western region having the highest at 19%, followed by the northern region at 12%. The central and eastern regions had a lower rise in the prevalence of hypertension.
Our study has highlighted an increase in hypertension in Uganda as previously reported [4, 7, 9]. Relevant studies conducted around the time coinciding with our surveillance data period suggest that the increase could be attributed to the rising age of the population as well as the transition from lower to higher incomes leading to changes in lifestyles[7, 10]. The adoption of Western ways with rapid urbanization throughout the urban and rural areas of not only Uganda has led to changes in dietary patterns, including increasing consumption of food high in salt, and sugar-sweetened beverages [11, 12]. In addition, there has been a shift towards motorized transportation with consequential lower physical activity all contributing to higher rates of obesity and hence hypertension [4, 13].
Our finding that the western region has had the highest rise in the prevalence of hypertension compared to other regions could further show the shift of population to rapid urbanization as more previously rural communities become townships. This evidence is different from a study in Uganda by Lunyera et al [8] but consistent with studies done in rural Uganda by Kayima et al [4] and in rural South Africa [14].
The eastern and central regions consistently had a lower prevalence of hypertension than other regions from 2016 to 2021. This would not be explained by the regional variation of incomes in these two regions compared to the populations in the western and northern regions [10, 15]. This perhaps correlates to high consumption of fruit and vegetables, more physical activity due to lack of modern transportation, and less salt and sugar consumption [11, 12, 15, 16].
Study limitations
Reports of hypertension, together with demographics, among outpatients is entered into the National Health Management Information System and DHIS2 for patients visiting public health facilities. However, hypertension screening is not done routinely in public health facilities. Instead, it is only done for patients namely; with signs and symptoms suggestive of hypertension or who have a known diagnosis, attending antenatal care, and those for whom clinicians request blood pressure measurements for other reasons. The highlighted hypertension prevalence is likely an underestimate of the true prevalence of hypertension in Uganda.
Conclusion
These findings highlight the increasing burden of hypertension in Uganda. There is an urgent need to implement focused public health interventions such as increasing awareness of the causes of hypertension and promoting lifestyle modifications to reduce its burden, avoid unavoidable health events, and achieve a 25% reduction in hypertension by 2025.There is a need to increase awareness about the burden of hypertension and promote cost-effective and sustainable healthier lifestyles that will mitigate its risk to cardiovascular and cerebrovascular morbidity and mortality.
Conflict of interest
Authors declare that they had no conflict of interest
Authors’ contributions: TK designed the study protocol, downloaded data from the DHIS2 dashboard, analysed the data, and compiled the bulletin. SZ, RM, DK, and AAR contributed to interpretation of results and writing of the bulletin and all approved the final draft.
Acknowledgments
The authors appreciate the bio-statisticians and surveillance officers who ensure that reporting of surveillance data is routinely done at their respective districts. We appreciate the DHIS2 team at the Ministry of Health for managing the DHIS2 platform. We also appreciate the Uganda Public Health Fellowship Program and the Ministry of Health for the technical support and guidance offered during this study. Finally, we thank the US-CDC for supporting the activities of the Uganda public health fellowship program.
Copyright and licensing
All materials in the Uganda Public Health Bulletin are in the public domain and may be used and reprinted without permission; citation as to source; however, is appreciated. Any article can be reprinted or published. If cited as a reprint, it should be referenced in the original form.
References
- Clark, D., et al., Population-attributable risk for cardiovascular disease associated with hypertension in Black adults. JAMA cardiology, 2019. 4(12): p. 1194-1202.
- WHO, Global health observatory data repository. World Health Organization, 2015.
- Allanson, E.R., M. Muller, and R.C. Pattinson, Causes of perinatal mortality and associated maternal complications in a South African province: challenges in predicting poor outcomes. BMC pregnancy and childbirth, 2015. 15(1): p. 1-7.
- Kayima, J., et al., Determinants of hypertension in a young adult Ugandan population in epidemiological transition—the MEPI-CVD survey. BMC public health, 2015. 15: p. 1-9.
- Mills, K.T., et al., Global disparities of hypertension prevalence and control: a systematic analysis of population-based studies from 90 countries. Circulation, 2016. 134(6): p. 441-450.
- Zhou, B., et al., Worldwide trends in hypertension prevalence and progress in treatment and control from 1990 to 2019: a pooled analysis of 1201 population-representative studies with 104 million participants. The Lancet, 2021. 398(10304): p. 957-980.
- Guwatudde, D., et al., The epidemiology of hypertension in Uganda: findings from the national non-communicable diseases risk factor survey. PloS one, 2015. 10(9): p. e0138991.
- Lunyera, J., et al., Geographic differences in the prevalence of hypertension in Uganda: Results of a national epidemiological study. PloS one, 2018. 13(8): p. e0201001.
- Mayega, R.W., et al., Modifiable socio-behavioural factors associated with overweight and hypertension among persons aged 35 to 60 years in eastern Uganda. 2012.
- UBOS, U.B.o.S., Statistical abstract. 2020.
- Akpa, O.M., et al., Regional patterns and association between obesity and hypertension in Africa: evidence from the H3Africa CHAIR study. Hypertension, 2020. 75(5): p. 1167-1178.
- Kaddumukasa, M., et al., Modifiable lifestyle risk factors for stroke among a high risk hypertensive population in Greater Kampala, Uganda; a cross-sectional study. BMC Research Notes, 2017. 10(1): p. 1-6.
- Ayoola, A., et al., Overweight and obesity in south central Uganda: A population-based study. PLOS Global Public Health, 2022. 2(11): p. e0001051.
- Maimela, E., et al., Interventions for improving management of chronic non-communicable diseases in Dikgale, a rural area in Limpopo Province, South Africa. BMC Health Services Research, 2018. 18(1): p. 1-9.
- Riha, J., et al., Urbanicity and lifestyle risk factors for cardiometabolic diseases in rural Uganda: a cross-sectional study. PLoS medicine, 2014. 11(7): p. e1001683.
- UBOS, U.B.o.S., Uganda Demographic and Health Survey 2016. 2018.
Comments are closed.