
Spatio-temporal trends of air quality in Kampala City, 2020–2022
Authors: Mackline Ninsiima1,2*, Alex Ndyabakira1,2, Richard Migisha1, Daniel Kadobera1, Daniel Ayen Okello2 / Institution affiliations: 1Uganda Public Health Fellowship Program, Uganda National Institute of Public Health, Kampala, Uganda, 2Kampala Capital City Authority, Kampala, Uganda. / Correspondence*: Email: mninsiima@uniph.ac.ug, Tel:+256787819496
Summary

Background: Fine particulate matter (PM2.5) is among the health damaging air pollutants that pose
adverse health risks to humans, with levels >15 µg/m3 being associated with serious health effects.
PM2.5 has been recommended as the best measure of air quality due to its prevalence in the
environment and broad range of health effects. We aassessed the spatio-temporal trends of air
quality based on the PM2.5 concentrations in Kampala City, January 2020 – June 2022.

Methods: PM2.5 concentrations generated by Clarity Node Solar-Powered monitors were abstracted from
the Clarity dashboard. We computed the 24-hour average PM2.5 from January 1, 2020–June 30, 2022 at
the city and division levels. Average PM2.5 concentrations per hour were compared by hour of the
day (midnight – 11pm) to understand the variations in air quality. Seasonal Mann-Kendall
statistical test was applied to assess the significance of the observed trends based on Kendall’s
tau correlation coefficient (r) and p-values.

Results: The 24-hour average PM2.5 was 59 µg/m3 (24-hourly average range: 18-182 µg/m3 from
January 1, 2020–June 30, 2022). High PM2.5 concentrations were observed in Kawempe and Central
compared to the other divisions. Two PM2.5 concentration peaks were observed from 10am–midday
(73.2 – 72.9 µg/m3) and 8pm–9pm (73.3–77 µg/m3). Generally, there was a negligible but significant
decreasing trend in air quality from January 2020 to June 2022 (r = -0.27, p < 0.001). Of note,
PM2.5 increased during April–June quarter throughout all evaluation years [2020 (r=0.56, p=0.006),
2021 (r=0.26, p=0.030), and 2022 (r=0.37, p=0.030)].

Conclusion: PM2.5 air concentrations in Kampala City exceeded the maximum WHO-recommended levels
even in times without vehicle traffic. Studies are needed to identify sources of pollution in
Kampala City to develop interventions to improve air quality.
Introduction
Air pollution, the contamination of air with substances that are harmful to human health, is one of the outstanding health concerns today [1]. It is a silent killer accounting for an estimated 6.67 million premature deaths worldwide [2]. Evidence links air pollution to varied conditions includes ischemic heart disease, stroke, lung cancer, chronic obstructive pulmonary disease, pneumonia, type 2 diabetes, and neonatal disorders. Air pollution has also been associated with many disastrous, but less evidence-based health impacts such as infant mortality, low birth weight, pre-term delivery, mental health conditions, and neurological impairment [3]. Sources of air pollution may be categorized as domestic solid biomass energy uses, exhaust and non-exhaust emissions from vehicles, industrial emissions, and burning of solid waste. According to World Health Organization (WHO) and United States Environmental Protection Agency (EPA), the major health-damaging measurable air pollutants are: particulate matter, ozone, nitrogen dioxide, sulfur dioxide, lead, and carbon monoxide.
Particulate Matter (PM) is formed in the atmosphere as a result of chemical reactions between different pollutants, and contains tiny liquid or solid droplets that can be inhaled dependent on their size and cause serious health effects [4]. Particulate matter pollution includes PM2.5, extremely fine particles with diameters that are generally 2.5 micrometers or smaller and PM10, particles with diameters of 10 micrometers and smaller. Fine particulate matter (PM2.5) is among the health damaging air pollutants that pose adverse risks to humans due to its small size and diameter: which easily permit penetration into invasive systems [5]. PM2.5 has been recommended as the best measure of air quality due to its prevalence in the environment and broad range of health effects. According to the 2021 World Health Organization Air Quality Guidelines, the 24–hour average targeted safe level of PM2.5 is less than or equal to 15 µg/m3 whereas the annual targeted safe level is less than or equal to 5 µg/m3. Long term exposure to unsafe levels of PM2.5 increases the risk of excess mortality from aggravated asthma, chronic obstructive pulmonary disease, lung cancer, stroke, diabetes mellitus, and incidence of maternal and fetal complications among others [6]. According to the Global Burden of Disease report, PM2.5 has been greatly attributed to occurrence of 6.4 million premature deaths [2, 3].
Cities are more prone to poor air quality compared to non-urban areas. This is attributed to high population density, exhaust emissions from vehicles and industries, infrastructure construction, open fuel and solid waste burning. Based on the 2021 World Air Quality Report, Kampala was ranked among the cities with polluted air 5 to 7 times higher than the WHO annual targeted “safe” level [7, 8]. Limited evidence has been presented about how PM2.5 concentrations is spatially and temporally distributed across Kampala City. Understanding the spatial and temporal distributions of PM2.5 concentrations is critical to act as a foundation for Kampala Capital City Authority and other government agencies to implement strategic evidence-based decisions to improve air quality in the city. We assessed the spatio-temporal trends of air quality based on the PM2.5 concentrations in Kampala City from January 2020 – June 2022.
Methods
In December 2019, Kampala Capital City Authority installed Clarity Node Solar-Powered Monitors for outdoor air quality monitoring in all the divisions of Kampala City; Kawempe, Nakawa, Central, Makindye and Rubaga. We conducted a secondary analysis of air quality surveillance data generated by Clarity Node Solar-Powered monitors. We abstracted hourly PM2.5 concentrations generated by calibrated clarity node solar powered monitors from January, 2020 – June, 2022 from the Clarity Dashboard.
For spatial distribution, 24-hourly average PM2.5 concentrations from January 1, 2020 – June 30, 2022 was computed at the city and division levels. We then used choropleth maps to show the distribution of 24-hour average PM2.5 concentrations across the divisions of Kampala City. We used a line graph to show the trend of the hourly average PM2.5 concentrations by hour of the day (midnight–11pm) to understand the variations of air quality by hour of the day. We also used a line graph to show the trend of the 24-hour average PM2.5 concentrations in Kampala City from January 1, 2020 – June 30, 2022. Seasonal Mann-Kendall (MK) statistical test was applied to assess the significance of the observed trends by quarterly periods. Statistical significance was set at a p-value <0.05.
Approval to conduct this project under the Non-Research Determination criteria was obtained from the U. S. Centers of Disease Control and Prevention (CDC). Administrative clearance to extract PM2.5 concentration data from the Clarity Dashboard was obtained from Kampala Capital City Authority (KCCA). All methods were performed in accordance with the Approval and Administrative Clearance.
Results
Variations of PM2.5 concentrations by hour of the week, January 2020–June 2022
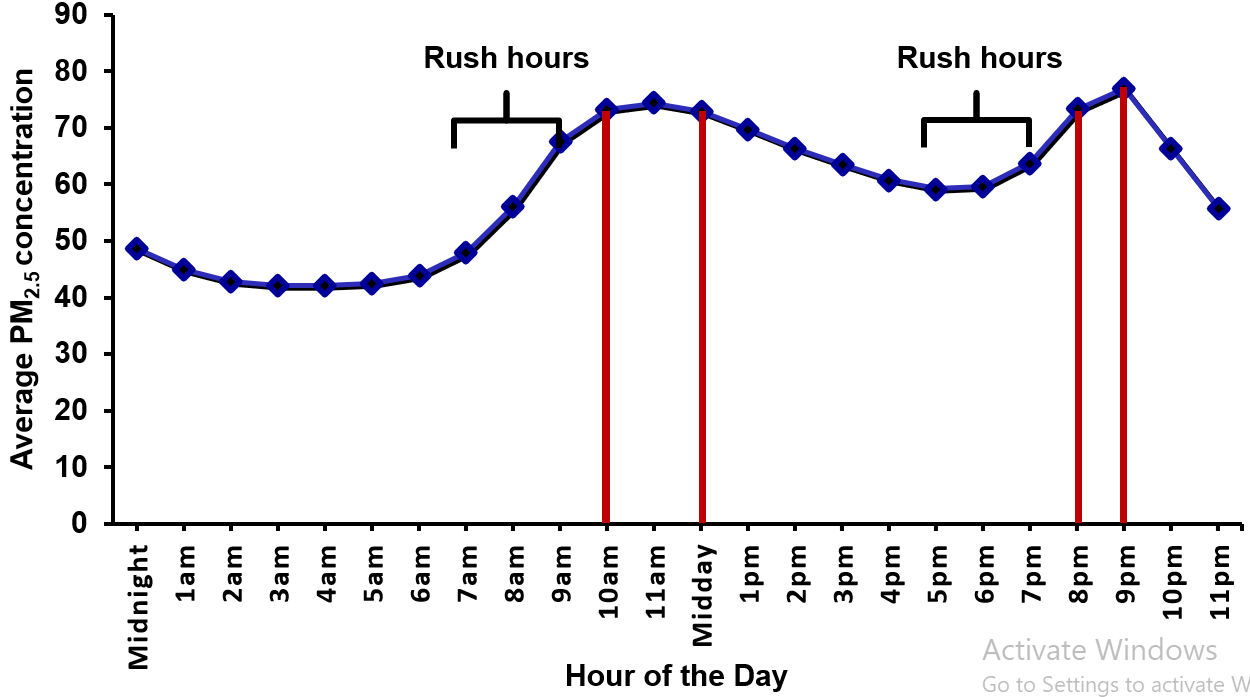
Two PM2.5 concentration peaks were observed throughout the day (Figure 1). The first peak was observed between 10am and midday (73.2 – 72.9 µg/m3) whereas the second peak was observed between 8pm and 9pm (73.3–77 µg/m3).
Spatial distribution of PM2.5 in Kampala City, January, 2020–June, 2022
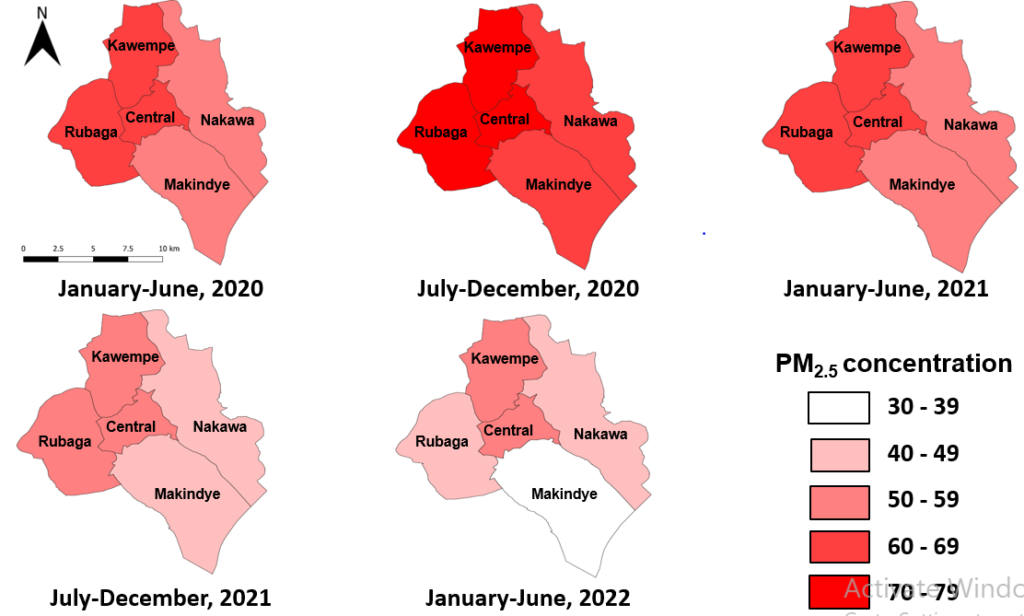
Overall, the 24-hour average PM2.5 concentrations was 59 µg/m3 in Kampala City from January, 2020–June, 2022. Despite the general decreasing trend in PM2.5 across the biannual periods, high PM2.5 concentrations were observed in Kawempe and Central compared to the other divisions (Figure 2).=
Trends of PM2.5 in Kampala City, January, 2020–June, 2022
There are cyclical variations of PM2.5 concentration alternating between 18 µg/m3 and 182 µg/m3 (Figure 3). Based on the correlation coefficient and p-value (r = -0.27, p<0.001), there is a negligible but significant decreasing trend in PM2.5 concentrations from January 2020–June 2022.
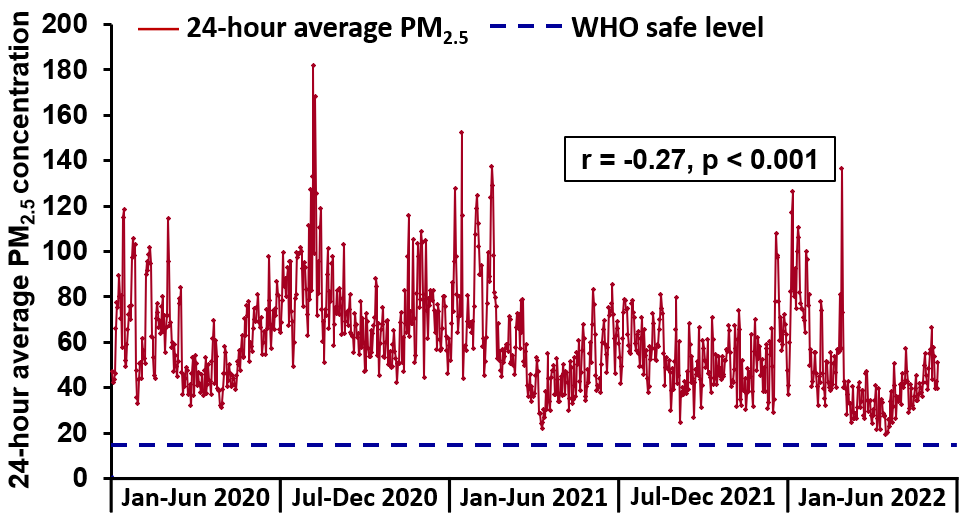
PM2.5 increased during April–June throughout all evaluation years [2020 (r=0.56, p=0.006), 2021 (r=0.26, p=0.030), and 2022 (r=0.37, p=0.030)] (Table 1). Another increasing significant trend was observed in October–December, 2020 (r=0.32, p=0.032).
Table 1: Trends of PM2.5 concentrations in Kampala City, January 2020–June 2022
| Quarterly periods | PM2.5 concentration range (Minimum – Maximum) | Seasonal Mann-Kendall test statistic (S’) | Kendall’s tau correlation coefficient | p-value |
| Jan – March 2020 | 32.0 – 118.5 | -68 | -0.27 | 0.051 |
| April – June 2020 | 31.5 – 97.8 | 142 | 0.56 | 0.006 |
| July – Sept 2020 | 49.3 – 106.2 | -48 | -0.19 | 0.054 |
| Oct – Dec 2020 | 42.5 – 116.0 | 80 | 0.32 | 0.032 |
| Jan – March 2021 | 43.7 – 152.1 | -48 | -0.19 | 0.138 |
| April – June 2021 | 22.0 – 82.6 | 66 | 0.26 | 0.030 |
| July – Sept 2021 | 24.7 – 85.2 | -108 | -0.43 | 0.008 |
| Oct – Dec 2021 | 27.1 – 73.0 | -2 | -0.01 | 0.967 |
| Jan – March 2022 | 24.1 – 134.8 | -104 | -0.41 | 0.011 |
| April – June 2022 | 18.8 – 66.1 | 94 | 0.37 | 0.030 |
Discussion
In this study, we assessed the spatio-temporal trends of air quality based on PM2.5 concentrations in Kampala City from January 2020─June 2022. We found that the 24-hour average PM2.5 concentration level was 59 µg/m3 (Range = 18-152 µg/m3 from January 2020-June 2022); exceeding the WHO targeted safe level at 15 µg/m3. Two peak hours with high levels of hourly average PM2.5 concentrations; (73.2–72.9) and (73.3–77) were observed during morning (10am–midday) and evening (8pm─9pm) hours of the day respectively. We also observed a general decreasing trend in the PM2.5 concentration indicating slight improvement in air quality in Kampala City.
High PM2.5 concentrations reported in this study coincide with a longitudinal study which reported relatively high levels of 24-hourly average PM2.5 at 47 µg/m3 (±29) [9]. Another longitudinal study across selected urban centers in Southern, Eastern, and Central Uganda showed that the 24-hourly average PM2.5 varied widely between 34 and 107 μg/m3 [10]. A pilot cross sectional spatial assessment conducted in Kampala City reported 24-hourly average PM2.5 concentration at 138.6 µg/m3 [11]. Ground assessments revealed that poorer air quality was observed in Kampala compared to Nairobi and Addis Ababa [12]. Regardless of the varying levels of the 24-hour average PM2.5 concentrations, there is unhealthy air quality evidenced by PM2.5 concentration exceeding the targeted safe level.
An observation of two PM2.5 concentration peaks at specified times of the day coincides with study findings from 3,110 sites across the world which showed that PM2.5 concentrations are higher in the morning (7:00-10:00 hrs) and evening (21:00-23:00 hrs) [13]. Air quality monitoring data generated by the Beta Attenuation Monitor (BAM) 1022 showed two PM2.5 peaks correspondingly registered at 08:00 hrs (61.3µg/m3) and 23:00 hrs (71.2 µg/m3) in the morning and evening hours in Kampala City[14]. Average circadian variations also showed twice-daily PM2.5 peaks early in the morning (06:00 to 08:00) and later in the evening (18:00 to 19:00) across 11 cities in Sub-Saharan Africa [9]. The morning and evening peak PM2.5 concentrations are highly attributed to thermal inversion and automobile traffic hours. PM2.5 concentrations during these traffic rush hours indicating that traffic emissions could be speculated among the biggest contributors of air pollution. The second peak in the evening is also impacted by the decrease in the planetary boundary layer, which increases the dispersion of PM2.5 concentrations to the ground level [12].
Despite the observed decreasing trend, the high PM2.5 concentrations observed in Kawempe and Central divisions could be attributed to divisions having many informal settlements, food businesses which use biomass fuel for cooking and small-scale industries which may not be complying to the emission inventory regulatory guidelines. However, the reasons for the general observed decreasing trend are unknown. It is possible that there could have been behavioral changes and less traffic on the roads that led to improved air quality over time, which may or may not be related to the COVID – 19 pandemic. Furthermore, the difference observed across the quarterly periods could also be attributed to meteorological parameters of rainfall density, humidity, temperature, wind speed, and atmospheric mixing layer height.
Study limitations
Three out of the 25 air quality monitors were non-functional for 4 months implying missing PM2.5 concentration data during the affected period. This could have led to underestimation or overestimation of the air quality levels during the affected months and overall assessment period.
Conclusion
We found unhealthy air quality evidenced by PM2.5 concentration exceeding the WHO targeted safe level even during times of less traffic and economic activities in Kampala City. Furthermore, there was a slight improvement in air quality evidenced by the decreasing PM2.5 concentration trend from January 2020 to June 2022.
However, the reasons for the observed decreasing trend are unknown. It is possible that there could have been behavioral changes and less traffic on the roads that led to improved air quality over time. Ultimately, there is need to prioritize the implementation of interventions aimed at improving air quality in Kampala city.
Based on this evidence, the Kampala Capital City Clean Air Action Plan with interventions spanning from individual responsibility to roles of different stakeholders towards improving air quality in the city was developed. Initiatives to improve air quality cannot be confined to only Kampala Capital City Authority; hence the need for multi-sectoral collaboration to achieve the mandate of the Kampala Capital City Clean Air Action Plan.
It is also important to conduct studies to understand the major contributing factors to poor air quality in this city.
Conflict of interest
The authors declare that they had no conflict of interest.
Acknowledgments
The authors would like to thank the Air Quality Management Team at Kampala Capital City Authority: Deogratious Kiryowa, Maximus Kwesiga, Henry Lutaaya, Owen Robert, Caroline Ssawe and Sebastian Hicks for supporting the outdoor air quality monitoring in Kampala City. Additional thanks to Clarity Movement Company and Department of Public Health and Environment, Kampala Capital City Authority for providing access to the data generated by Clarity Node Solar-Powered monitors.
Copyright and licensing
All materials in the Uganda National Institute of Public Health Quarterly Epidemiological Bulletin is in the public domain and may be used and reprinted without permission; citation as to source; however, is appreciated. Any article can be reprinted or published. If cited as a reprint, it should be referenced in the original form.
References
-
IHME, HEI, and UBC, Institute for Health Metrics and Evaluation, Health Effects Institute,
University of British Columbia. State of Global Air; Global Health Impacts of Air Pollution.
Available from: https://www.stateofglobalair.org/health/global. Accessed on: 28th May 2022.
2020.
-
Murray, C.J., et al., Global burden of 87 risk factors in 204 countries and territories,
1990–2019: a systematic analysis for the Global Burden of Disease Study 2019. The Lancet,
2020. 396(10258): p. 1223-1249.
-
World_Bank, The Global Health Cost of PM2. 5 Air Pollution: A Case for Action Beyond 2021.
2022, The World Bank.
-
Manisalidis, I., et al., Environmental and health impacts of air pollution: a review.
Frontiers in public health, 2020: p. 14.
-
Zhang, L., et al., Short-term and long-term effects of PM2. 5 on acute nasopharyngitis
in 10 communities of Guangdong, China. Science of the Total Environment, 2019. 688: p.
136-142.
-
Sang, S., et al., The global burden of disease attributable to ambient fine particulate
matter in 204 countries and territories, 1990–2019: A systematic analysis of the Global
Burden of Disease Study 2019. Ecotoxicology and Environmental Safety, 2022. 238: p.
113588.
-
IQAir, 2021 World Air Quality Report: Region & City PM2.5 Ranking. Available from:
file:///C:/Users/HP/Downloads/world-air-quality-report-2021-en%20(1).pdf. Accessed on:
9th June 2022. 2021.
-
Petkova, E.P., et al., Particulate matter pollution in African cities. Air Quality,
Atmosphere & Health, 2013. 6(3): p. 603-614.
-
Awokola, B., et al., Longitudinal Ambient PM2. 5 Measurement at Fifteen Locations in Eight
Sub-Saharan African Countries Using Low-Cost Sensors. Atmosphere, 2022. 13(10): p. 1593.
-
Okure, D., et al., Characterization of Ambient Air Quality in Selected Urban Areas in
Uganda Using Low-Cost Sensing and Measurement Technologies. Environmental Science &
Technology, 2022. 56(6): p. 3324-3339.
-
Kirenga, B.J., et al., The state of ambient air quality in two Ugandan cities: a pilot
cross-sectional spatial assessment. International journal of environmental research and
public health, 2015. 12(7): p. 8075-8091.
-
Singh, A., et al., Air quality assessment in three East African cities using calibrated
low-cost sensors with a focus on road-based hotspots. Environmental Research
Communications, 2021. 3(7): p. 075007.
-
Manning, M.I., et al., Diurnal patterns in global fine particulate matter concentration.
Environmental Science & Technology Letters, 2018. 5(11): p. 687-691.
-
Atuyambe, L., et al. The status of air quality in Kampala city, Uganda 2017-2019: Results
from the Eastern Africa GEOHealth Hub using a high-tech reference monitor (Beta Attenuation
Monitor 1022). in ISEE Conference Abstracts. 2020.
DOWNLOAD THIS ARTICLE
Comments are closed.