Patterns of Malnutrition among Pregnant and Lactating Women, Uganda, 2015-2018: Analysis of Nutrition Surveillance Data
Authors: Irene B. Kyamwine1*, Samalie Namukose2, Lilian Bulage1, Benon Kwesiga1, Alex R. Ario1
Affiliations: 1 Uganda Public Health Fellowship Program, Ministry of Health, Kampala, Uganda
2 Nutrition Division, Ministry of Health, Kampala, Uganda
Summary
Maternal nutrition is closely linked to survival and development of children during the first 1000 days of life. Despite significant improvements in the last 5 years of implementation of the Uganda Nutrition Action Plan, malnutrition remains a major public health problem in Uganda. We described annual trends and distribution of malnutrition among pregnant and lactating women (PLW) to inform programming on targeted malnutrition interventions. We analyzed nutrition surveillance data from the District Health Information System (DHIS2) for all PLW in Uganda from 2015-2018. We used WHO standard for severity of malnutrition. We calculated prevalence of malnutrition among PLW and conducted logistic regression to assess trends. We drew line graphs to illustrate annual trends and choropleth maps to demonstrate geographic distribution. We found 268,636 (prevalence: 5.5%) PLW had acute malnutrition. Karamoja (prevalence: 21%), Lango (prevalence: 17%), and Acholi (prevalence: 11%) registered the highest prevalence. Kigezi (prevalence: 2%), Toro (prevalence: 2.7%), and Ankole (prevalence: 2.8%) regions registered the lowest overall prevalence. The annual national trend of malnutrition decreased by 31% (OR=0.69, p<0.001) over the evaluation period. Bugisu (OR=3.4, p<0.001), Lango (OR=1.6,
p<0.001), Bukedi (OR=1.4, p<0.001), Busoga (1.3, p<0.001, and Acholi (OR=1.2, p<0.001) had an increasing trend of malnutrition while the remaining regions had declines. The Ministry of Health should reinforce interventions in place for malnutrition with special attention to Kara- moja, Lango, Acholi, and Bugisu regions. Also, a nutrition causal analysis among PLW in these regions should be conducted.
Introduction
Malnutrition refers to deficiencies, excesses or imbalances in a person’s intake of energy and/or nutrients. It includes both – undernutrition which covers: stunting, wasting, and micronutrient deficiencies; and over nutrition which includes overweight, obesity, and diet-related non-communicable diseases (1). Maternal nutrition is crucial for the survival, health, and development of mothers and their children(3,4). During pregnancy and lactation, there is an increased demand for energy, protein, and essential micronutrients to maintain the mother and child’s health and development in and out of the uterus (5–8). Maternal malnutrition predisposes mothers to maternal complications and children to fetal birth defects, low birth weight, restricted physical and mental potential; and fetal or newborn mortality (5). Maternal under nutrition accounts for approximately 20% of child hood stunting (9).
Uganda scaled up the Nutrition strategy in 2011 focusing on the first 1,000-days window of opportunity directed at women in reproductive age, newborns and children <2 years (10).This strategy was aimed at breaking the cycle of malnutrition and improving the livelihood of Ugandans. In spite of significant improvements in the 5 years of implementation of this strategy (2011-2016), under nutrition has remained a major public health problem in Uganda. Uganda demographic health survey (UDHS) 2016, reported 29% children stunted, 11% wasted, and at least 32% of women in reproductive age were anemic. However, little characterization of malnutrition specific among pregnant or lactating women has been done in Uganda.
A malnourished mother at any stage during her development is likely to deliver a malnourished baby due to her predisposition to the effects of malnutrition hence continuing the cycle (5). Therefore, ending mal- nutrition among pregnant and lactating women (PLW) is important in breaking this cycle. To inform targeted programming and break the cycle of malnutrition, we described the epidemiological trends and quantum geographical distribution of malnutrition among PLW in Uganda, 2015–2018
Methods
We conducted a descriptive cross-sectional analysis of surveil- lance data from the district health information system 2 (DHIS2). We extracted data on malnutrition among PLW reported quarterly,2015–2018. We also, extracted data on the reporting rates of the HMIS 106 for the same period. We defined malnutrition as under nutrition (wasting). We calculated prevalence of malnutrition at national and regional levels disaggregated by year. Our denominator was PLW assessed for malnutrition. We classified regions using WHO classification of malnutrition se- verity which uses prevalence thresholds: <5% is acceptable, 5- 9% poor, 10-14% serious and >15% critical (11). We generated trends nationally and regionally; and used logistic regression to test for significance of the trends. We used geographic information system (QGIS) version 2.8.2 to generate maps.
Results
Distribution of malnutrition among pregnant and lactating women in Uganda, 2015-2018.
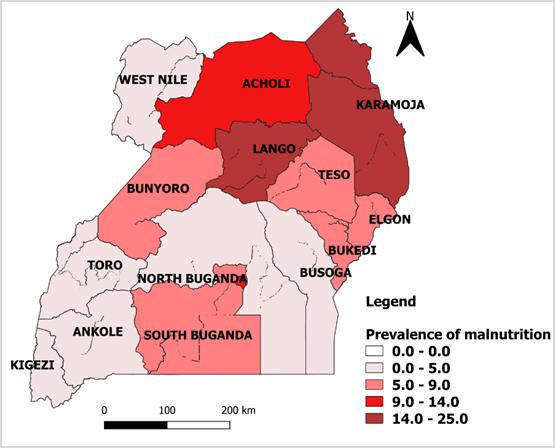
Of 4,848,873 PLW assessed for malnutrition, 268,636 (5.5%) had malnutrition. Karamoja region had the highest overall prevalence of 21% (44,010/209,244) followed by: Lango 17% (13,242/80,356), Acholi 11% (21,229/199,085), and Kampala 10% (17,164/168,345).
Kigezi 2% (11,480/571,010), Toro 2.7% (15,776/59, 5237), and Ankole 2.8% (22,085/785,154) regions had the lowest overall prevalence. Karamoja and Lango were in the critical category (prevalence >15%) while Acholi was in the serious category of the WHO classification of malnutrition (Figure 1).

Trends of malnutrition among pregnant and lactating women in Uganda, 2015-2018
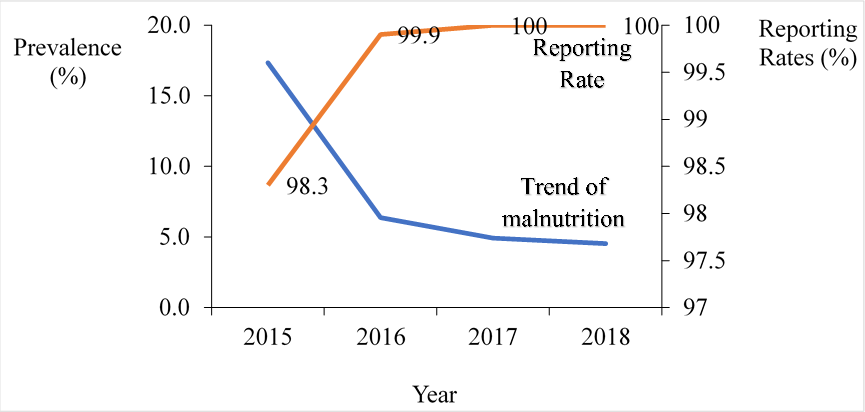
During period 2015 to 2018, the annual prevalence of malnutrition among PLW at national level declined by 31% (OR= 0.69, p < 0.001) being highest in 2015, 17% (38,480/223,310) reducing to 6.4 % (52,945/830,624) in 2016, and the lowest in 2018, 4.5% (102,109/2,248,324). The reporting rate increased from 98.3% in 2015 to 100% in 2018 (Figure 2).

Trends of malnutrition among pregnant and lactating women per region in Uganda, 2015-2018
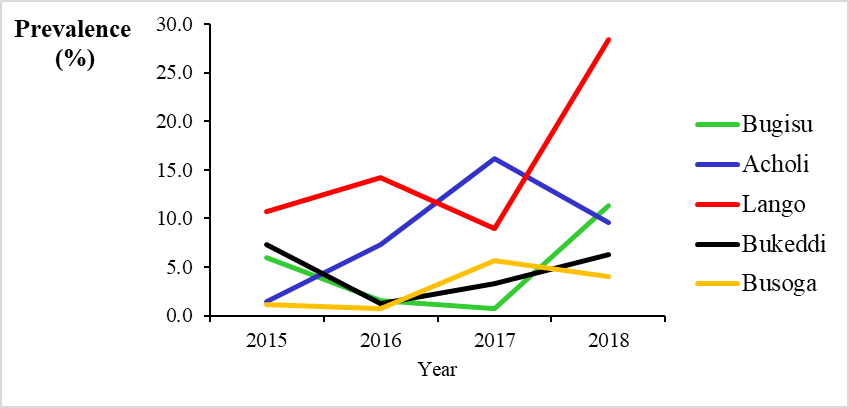
The prevalence of malnutrition among PLW increased in Bugisu (OR=3.4, p<0.001), Lango (OR=1.6, p<0.001), Bukedi (1.4, p<0.001), Busoga (OR=1.3, p<0.001), and Acholi (OR=1.2, p<0.001) regions (Figure 2); while the rest of the regions had declining trend (Figure 3).

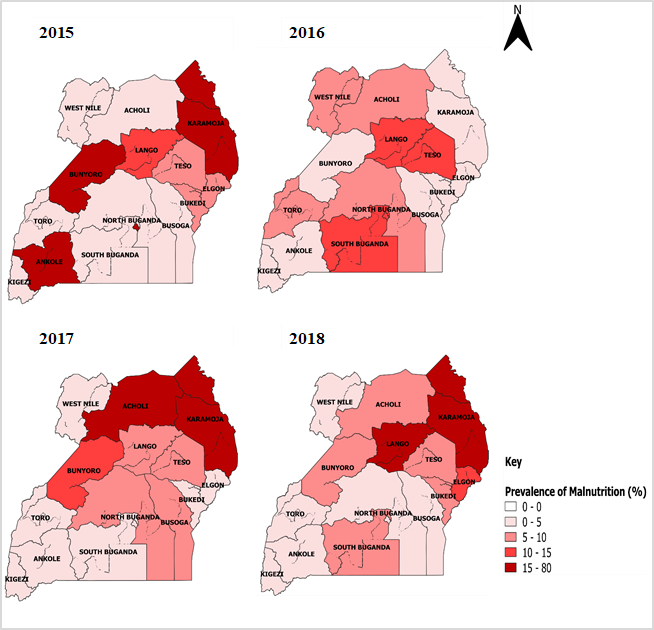
Kampala region had the highest rates of malnutrition in 2015, 77% (9,308/12,099) followed by Karamoja region 70% (19,723/28070) and 28.5% (282/989) in Bunyoro region. In 2018, Lango region had the highest prevalence 28% (6,919/24,403) followed by Karamoja region with prevalence of 16% (12,251/72,202) and Bugisu 11% (8,766/77,327). Kigezi region had the lowest prevalence 0.57% (1,264/221,334) (Figure 4)

Discussion
This analysis of surveillance data showed a national decreasing trend in malnutrition among pregnant and lactating women. However, the trend of malnutrition declined in the Western and Southern regions while increases were registered in the Eastern and Northern regions. The Northern regions were in the critical and serious categories of the WHO classification of malnutrition.
Findings of this analysis revealed that the overall national trend of malnutrition among PLW declined. While the down ward trend in malnutrition is encouraging, there are regions with high levels of
malnutrition and some have increasing trends. Similarly, findings from UDHS 2016 and an analysis by SPRING, 2014 showed that mal- nutrition among women in reproductive age was present in various regions. In 2014 a correlation between maternal under nutrition and low levels of the 4+ ANC, inadequate nutrition counselling, low level female control of income and limited access to a health facility were found in these regions (12). Providing nutrition education and ANC services in the community could improve the nutrition status among PLW in the regions (13,14). These interventions should however, be given in the Acholi, Bugisu, Bukedi, Busoga Karamoja, and Lango regions that have high or rising prevalence of malnutrition.
Our analysis also found that Karamoja, Lango, and Acholi regions had the highest prevalence though the trend declined in Karamoja. These regions have prolonged droughts, insecurity, livestock diseases, and flooding which cripple crop and livestock production (16). In addition, the pastoralists nature of these regions makes cultivating difficult further deepening the food insecurity and also hindering access to preventive and treatment of major illnesses that cause mal- nutrition (16). Establishment of sentinel sites to provide health and nutrition services within this region could reduce delay in seeking care and also provide the essential nutrition interventions. Moreover, intensifying supplementary and therapeutic feeding programs for pregnant and lactating women could reduce malnutrition in these regions (17). Programs targeting households rather than individuals would possibly be better since the food is shared in the household (18).
Bugisu region also demonstrated to have increasing trend of malnutrition reaching the serious WHO severity level in 2018. This could be explained by the recurrent disasters such as mudslides, floods among others that occur in this region(19,20). These cause loss of crops and some- times lives rendering the affected population vulnerable to food insecurity, poverty hence malnutrition. Similarly a study in India found that children from flooded households had more malnutrition compared to those from households that had no flooding(21). Implementation of assistance in form of food or cash transfer, or both food and cash transfer could help in preventing malnutrition among PLW in such emergencies. However, these programs should focus on households rather than individuals since these individuals share the food with the entire house- hold hence end up not getting adequate quantities as required (18).
Conclusion and recommendations
The national trend of malnutrition among pregnant and lactating women declined during the analysis period 2015-2018. Lango and Acholi regions had high and rising rates of malnutrition. Karamoja and Lango regions were in critical category while Acholi region was in serious cate- gory according to the WHO classification of malnutrition. We recommended that Ministry of Health sustains interventions for malnutrition in place with special attention to Karamoja, Lango, and Acholi regions. Also, a nutrition causal to clearly understand the factors underlying malnutrition among PLW in these regions should be conducted.
References
- World Health Organization (WHO). Malnutrition [Internet]. 2018. p. Available from: https://www.who.int/news-room/fact-sheets/detail/ malnutrition
- World Health Organization (WHO). Essential Nutrition Actions. 2013
- Wu G, Bazer F, Cudd T, Meininger C. Recent Advances in Nutritional Sciences-Maternal Nutrition and Fetal Development. Nutr [Internet]. 2004;(13):2169–72. Available from:http://scholar.google.com/scholar? hl=en&btnG=Search&q=intitle:Recent+Advances+in+Nutritional+Sciences+Maternal+Nutrition+and+Fetal#8
- Vir SC. Improving women’s nutrition imperative for rapid reduction of childhood stunting in South Asia: Coupling of nutrition specific interventions with nutrition sensitive measures essential. Matern Child Nutr. 2016;12:72–90.
- WHO. ICD-10 Transition. Fam Pract Manag [Internet]. 2011;18:39. Available from: http://www.ncbi.nlm.nih.gov/pubmed/22184833
- Health UMOF. Guidelines on Maternal Nutrition in Uganda. 2010; (December):1–37.
- Government of Uganda. UGANDA NUTRITION ACTION PLAN Scaling Up Multi-Sectoral Efforts to Establish a Strong Nutrition Foundation for Uganda’s Development. Republic Of Uganda. 2011


Comments are closed.