Malaria morbidity following Indoor Residual Spraying in Eastern and Northern Uganda: A comparative analysis of IRS and non-IRS districts 2013-2016
Authors: Joselyn Annet Atuhairwe1, Jimmy Opigo2, Bosco Bekiita Agaba2, Damian Rutazaana2, Daniel Kyabayinze2, Claire Biribawa1, Alex Riolexus Ario1, Daniel Kadobera2 ,Adoke Yeka3; Affiliations: 1Uganda Public Health Fellowship Program, 2 National Malaria Control Program Uganda, 3Makerere University School of Public Health
Summary
Indoor Residual Spraying (IRS) with insecticides has proven to be effective against malaria morbidity. Districts in Northern and Eastern part of Uganda have implemented IRS since 2014. Up to now, there has been paucity of information on the effectiveness of IRS on malaria morbidity in those districts. We therefore analysed malaria morbidity surveillance data from 2013-2016 comparing IRS and non-IRS districts to evaluate the effectiveness of IRS. The number of confirmed malaria cases in five IRS districts declined by 22% between 2013 and 2016. Non-IRS districts registered 137% increase in the total number of malaria between 2013 and 2016. The modelling results showed that, in reference to 2013, IRS districts had 47% fewer confirmed malaria cases compared to the non-IRS districts by 2016 (Incidence Rate Ratio [IRR] = 0.53; 95% CI=0.43-0.66).IRS application was associated with a significant reduction in malaria morbidi. We recommend that IRS should be used as one of the key strategies for malaria control in endemic areas in Uganda.
Introduction
Malaria poses the greatest burden on Uganda’s health care system and is responsible for most of the morbidity and mortality in all age groups (1, 2). About half of the entire outpatient visits, almost a quarter of hospital admissions and three in every twenty deaths in Uganda are due to malaria (2). Significant progress in malaria control has been realized in the last decade due to increased access to proven interventions such as Long Lasting Insecticide Treated Nets (LLINs), treatment with Artemisinin based Combination Therapies (ACTs), Intermittent Preventive Therapy (IPT) for high risk groups and IRS (3).
Despite this progress, Uganda was among the top thirteen countries accounting for 75% of the global death due to Malaria in 2015(3). Uganda has embraced Integrated Vector Management including Indoor Residual Spraying of houses with insecticides as one of the strategies for malaria control(4). IRS was first introduced in Uganda in 2006 in the epidemic prone districts south west of the country. Between 2009 and 2013 IRS was implemented in 10 northern Uganda districts where it led to a reduction of the malaria prevalence from 40% to less than 7%(2). In 2014, following mass distribution of LLINs, IRS was with- drawn from the ten Northern Uganda districts and introduced to 14 new districts in eastern and northern Uganda. The need for evaluation of malaria control interventions has been highlighted by many researchers (3, 5, 6). Studies that have attempted to evaluate the impact of IRS in Uganda have shown temporal association between malaria morbidity and IRS implementation and have the strength of patient level data use (7,8).
However no study has done a comparison between IRS and non IRS districts to determine whether the observed reduction in malaria cases is significantly different between two groups. We therefore evaluated the impact of IRS on malaria morbidity in five districts in comparison to five non-IRS districts
Methods
We conducted a retrospective comparative analysis of malaria surveillance data captured in the HMIS electronic database (DHIS2) for the period 2013-2016. Data was analysed for 5 IRS and 5 non-IRS districts. The IRS districts were Dokolo, Kaberamaido, Lira, Otuke and Tororo while the non-IRS districts were Abim, Amuria, Bukedea, Iganga and Kamuli. The IRS districts included in the study started IRS in December 2014 with similar insecticide sprays (Bendiocarb for the first three rounds and Actellic for the fourth round) and spray dates for the remaining spray rounds.
Non-IRS districts were from the same regions as the 5 IRS districts hence similar climatic conditions and have never implemented IRS at whatever scale between 2013 and 2016. Additionally, their malaria incidences were comparable to those of the 5 IRS districts in the baseline year (2013). Population data was also obtained from the 2002 and 2014 census reports (UBOS). An annual population growth rate of 3% was used to compute the 2013 population while a 3.03% population growth rate was used to compute the 2015 and 2016 population. The data was cleaned, collated, merged, coded and used to compute other variables that were relevant for the analysis.
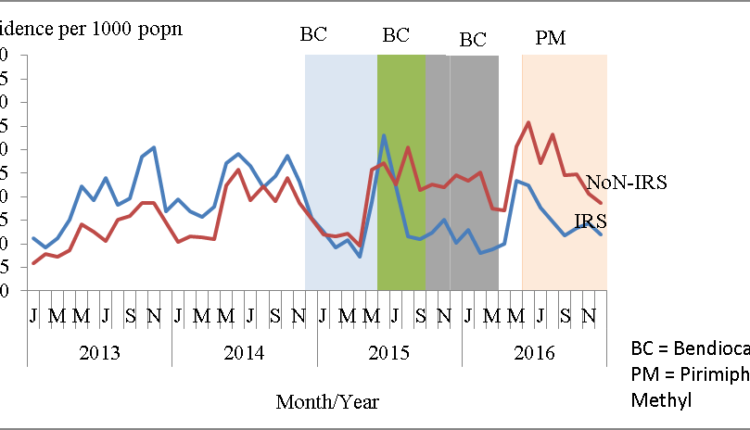
To study the trends in malaria incidence in 5 IRS districts and 5 non-IRS districts, we computed incidence using the formula: Incidence=(Confirmed malaria cases (microscopy + RDT))/ Population*1000. Graphs of incidence against time were then plotted with spray dates superimposed to help interpret the results.
To compare the changes in the confirmed malaria cases among 5 IRS and 5 non-IRS districts, we fit a negative binomial regression model to total confirmed malaria cases reported in IRS and non IRS districts. We used natural log of population as the off- set to cater for differences in population, and included rainfall level, monthly district reporting rates, Monthly Blood Examination Rate (MBER) and the 2013 (baseline) confirmed malaria cases as covariates. Modelling was done at annual levels.
Results
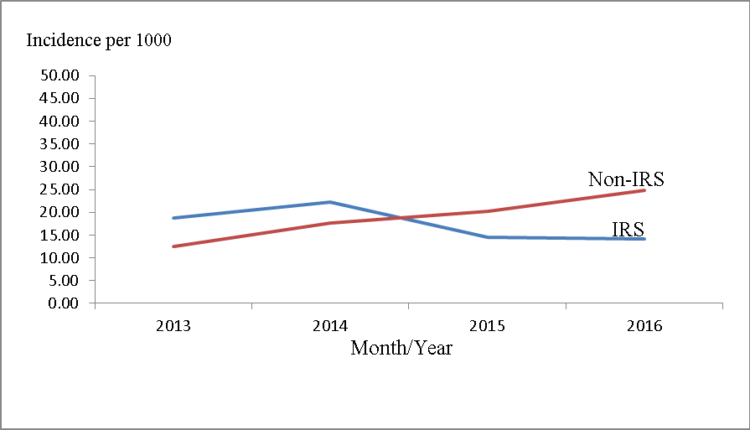
Malaria incidence in the IRS districts was slightly higher than that of the non-IRS districts at baseline (2013) and in the first year of IRS implementation. After IRS introduction in the intervention districts, malaria incidence dropped below that of the non-IRS districts. This trend was consistent through- out the IRS implementation period.

Monthly trends in malaria incidence in IRS and non IRS districts 2013-2016
Malaria trends in the two study areas seem to follow a season- al pattern with peaks around June and August. Despite this seasonal trend, malaria incidence in the non-IRS districts was higher than the IRS districts ever since IRS was first introduced as a malaria control intervention.

Trends of confirmed malaria cases in IRS and Non IRS districts 2013 – 2016
Compared to the baseline, IRS districts registered a progressive reduction in the number of confirmed malaria cases in 2015 (18%) and 2016 (22%). Non-IRS districts however registered an increase in the number of confirmed malaria cases in all the years with the highest being registered in 2016 where it more than doubled the baseline (137%).
Table 1: Trends in confirmed malaria cases in IRS and Non IRS districts 2013-2016
| IRS districts | Non-IRS districts | |||
| Year | Malaria cases | % change | Malaria cases | % change |
| 2013 | 306016 | 0 | 219239 | 0 |
| 2014 | 362014 | 18 | 335645 | 53 |
| 2015 | 251485 | -18 | 395729 | 81 |
| 2016 | 239459 | -22 | 519446 | 137 |
Changes in number of confirmed malaria cases in IRS and Non-IRS districts
Though IRS and Non-IRs districts had comparable numbers of confirmed malaria cases at baseline, significant differences between the two groups were first noted two years after introduction of IRS. By 2016, the IRS districts had 47% fewer con- firmed malaria cases compared to non-IRS districts in reference to the baseline year (IRR= 0.53; 95% CI= 0.39-056) after accounting for rainfall, MBER, reporting rates, differences in the number of malaria cases at baseline and offsetting differences due to population.
Table 2: Multivariate Negative binomial regression showing changes in number of confirmed malaria cases in IRS and Non-IRS districts
| Year of intervention | Variable | IRR (95% C.I) |
| Baseline (2013) | IRS Districts | 1.1(1.0-1.3) |
| Non-IRS Districts | 1 | |
| Year 1 (2014) | IRS Districts | 1.0 (0.9-1.1) |
| Non-IRS Districts | 1 | |
| Year 2 (2015) | IRS Districts | 0.8 (0.7-0.9) |
| Non-IRS Districts | 1 | |
| Year 3 (2016) | IRS Districts | 0.53 (0.43-0.66) |
| Non-IRS Districts | 1 |
Discussion
We found that implementation of IRS was associated with a significant reduction in morbidity due to malaria. Two years following introduction of IRS, IRS districts registered 22% reduction in the number of confirmed IRS districts while the non-IRs districts experienced a 137% increase. At the same time, the number of confirmed malaria cases in IRS districts were 47% fewer than those in the non-IRS districts in reference to the baseline year.
Studies conducted in Northern Uganda found that IRS was followed by reduction in slide positivity rate of up to 9.5% point (7-9). While these studies looked at a before after scenario, they did not have a comparative group of non-IRS district similar to this study.
The challenge for malaria control remains sustaining the gains achieved by the control interventions. Studies have showed that the benefits of IRS waned off four months after IRS followed by increase in slide positivity rate (SPR) while withdraw of IRS was followed by a malaria epidemic (7-10).
There is need for a detailed study into residual malaria transmission; associated factors, vectors responsible including evaluation of new tools so as to target the residual transmission of malaria transmission (11). Our study did not evaluate the effect of the different insecticides.
Conclusion and recommendations
IRS application was associated with a significant reduction in malaria morbidity. We recommend that IRS continues to be used as one of the key strategies for malaria control in endemic areas in Uganda. Further studies should analyse the effect of different classes of insecticides on malaria morbidity and conduct investigations into residual malaria transmission.
References
- MoH. <AHSPR FY 2015-16.pdf>. 2015/2016.
- Uganda Malaria Indicator Survey 2014-152015.
- <World Malaria Report .pdf>. 2016.
- <The Uganda Malaria Reduction Strategic Plan 2014-2020.pdf>2014.
- Yeka A, Gasasira A, Mpimbaza A, Achan J, Nankabir- wa J, Nsobya S, et al. Malaria in Uganda: Challenges to con- trol on the long road to elimination. Acta Tropica. 2012;121 (3):184-95.


Comments are closed.