

Malaria Diagnostic Utilization Across Health Facility Levels in Uganda: Analysis of Routine District Health Information System 2 Data, 2024-2025
Authors: Florence Nambaziira Muzaale*1,2, Samuel Gidudu1, Winnie Agwang1, Eunice Ainomugisha3 Institutional affiliations: 1National Institute of Public Health, Ministry of Health. Kampala, Uganda; 2Medical Research Council, Uganda Virus Research Institute, Entebbe, Uganda; 3Uganda Virus Research Institute, Entebbe, Uganda *Correspondence: Tel: +256 774596061, Email: fnambaziira@uniph.go.ug

Summary
Background: WHO recommends parasitological confirmation of suspected malaria using microscopy or mRDTs. In Uganda, microscopy is expected at higher-level facilities, while mRDTs predominate at lower-level facilities. Workload, equipment, and availability may influence diagnostic practices. Study compared utilization by level and ownership..
Methods: We conducted a retrospective descriptive analysis of malaria diagnostic data (HMIS 105) reported by Health Centre III, Health Centre IV, regional referral hospitals, and national referral hospitals between January 2024 and December 2025. Facilities were classified by level, ownership (government, private not‑for‑profit, private for‑profit), region, and district. We calculated utilisation as the proportion of total malaria tests performed by each method and compared results across facility characteristics and years using chi‑square tests.
Results: A total of 26,457,810 malaria diagnostic tests were reported in 2024 and 26,769,816 tests in 2025.Nationally, mRDTs accounted for most testing (79.7% in 2024; 80.2% in 2025), while microscopy declined slightly (20.3% to 19.8). Reliance on mRDTs was highest at Health Centre III and IV, whereas Regional Referral Hospitals showed increasing microscopy use. By ownership, government facilities relied most on mRDTs (85.6 in 2024 and 86.1% in 2025), private-for-profit facilities made the greatest use of microscopy (58.2 in 2024 and 58.8%in 2025 ), and private not-for-profit facilities fell between (37.5 in 2024 and 39.8% microscopy in 2025). Malaria diagnostic utilization varied across regions and districts, and in both years, mRDT utilization was generally highest in Northern and Western districts, while several Central districts, including Kampala and Masaka, reported comparatively lower mRDT utilization and greater microscopy use.
Conclusion: Malaria diagnosis in Uganda remained heavily dependent on mRDTs, with substantial variation across facility levels and ownership categories. mRDTs predominated at HC III and HC IV facilities, while microscopy was more frequently utilized in referral and private facilities.
Background
Malaria remains a major cause of morbidity and mortality in Uganda, accounting for a substantial proportion of outpatient visits, hospital admissions, and inpatient deaths. Children under five years of age bear a particularly high burden, with increased risk of severe disease and death. Despite progress in malaria control and improvements in laboratory systems, malaria remains a priority communicable disease in Uganda. Accurate diagnosis is essential for appropriate case management, rational use of antimalarial medicines, and reduction of malaria-related morbidity and mortality (1).
Uganda’s Malaria Reduction and Elimination Strategic Plan (2021–2025) emphasizes parasite-based diagnosis as a core component of malaria case management, consistent with World Health Organization recommendations for parasitological confirmation of suspected malaria cases. Microscopy and malaria rapid diagnostic tests (mRDTs) are the two main methods used for malaria diagnosis. Microscopy allows detection of malaria parasites, species identification, and parasite quantification, which can be important in the assessment of severe disease and monitoring of treatment response. mRDTs provide rapid parasitological confirmation but may have limitations in detecting non-Plasmodium falciparum infections when tests target only P. falciparum-specific antigens (2–4) .
Malaria diagnostic capacity varies across levels of the health system. Health Centre III facilities and higher-level facilities are expected to have microscopy capacity, while lower-level facilities may rely predominantly on mRDTs. Uganda’s health system comprises government, private not-for-profit, and private for-profit facilities, which contribute routine malaria service data through the District Health Information Software 2 (DHIS2) platform (5–7).
Despite national and global recommendations on parasite-based diagnosis, utilisation of malaria diagnostic methods may vary across health facilities. Factors such as availability of trained laboratory personnel, quality-assurance systems, diagnostic commodity stock-outs, laboratory infrastructure, and facility capacity can influence which diagnostic methods are used. However, routine national-level evidence describing how microscopy and mRDTs are utilised across different health-facility levels and ownership categories remains limited. Understanding these patterns is important for identifying gaps in diagnostic capacity and informing the allocation of laboratory resources, commodities, and quality-improvement interventions(5,6).
Routine DHIS2 data provide an opportunity to examine malaria diagnostic utilisation across the health system without additional patient-level data collection. We assessed the utilisation of recommended malaria diagnostic methods microscopy and mRDTs across health-facility levels and ownership categories in Uganda using routine DHIS2 data from 2024 to 2025.
Methods
We conducted a retrospective descriptive study using routinely collected malaria surveillance data reported through Uganda’s District Health Information Software 2 (DHIS2) from January 2024 to December 2025. The analysis included 2,164 Health Centre IIIs, 295 Health Centre IVs, 16 Regional Referral Hospitals, and 9 National Referral Hospitals reporting malaria diagnostic data. Facilities were classified by ownership, region, and district.
Data were extracted from routine HMIS 105 reports and included numbers of malaria tests performed by microscopy and malaria rapid diagnostic tests (mRDTs), facility level and ownership, district, region, month, and year. Data were reviewed for completeness, consistency, and implausible values before analysis.
Diagnostic utilisation was defined as the proportion of all malaria diagnostic tests performed using microscopy or mRDTs. Total malaria tests were calculated as the sum of microscopy and mRDT tests. Utilisation was assessed nationally and compared by facility level, ownership, region, district, month, and year.
Descriptive statistics were used to summarize diagnostic utilisation. The study used routinely collected, aggregated DHIS2 surveillance data with no individual patient identifiers. The analysis was conducted as part of Ministry of Health malaria surveillance and programme-monitoring activities, with confidentiality and data security maintained throughout.
Results
Overall Malaria Diagnostic Testing Volume, Uganda, 2024-205
A total of 26,457,810 malaria tests were reported in 2024 and 26,769,816 tests in 2025. The total number of reported malaria tests increased slightly between the two years.
Malaria diagnostic utilization, Uganda, 2024-2025
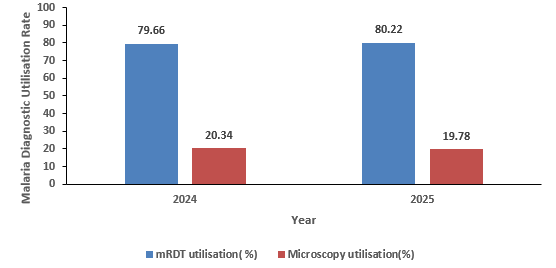
mRDTs were the dominant malaria diagnostic method nationally in both years. mRDT utilization increased from 79.7% in 2024 to 80.2% in 2025, while microscopy utilization declined from 20.3% to 19.8% (Figure 1).
Malaria diagnostic utilization by health facility level, Uganda, 2024-2025
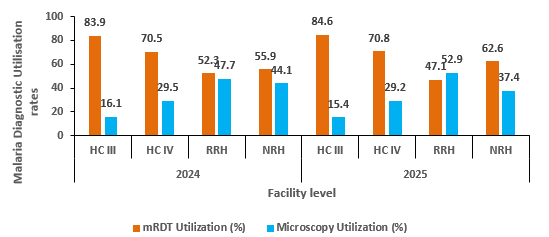
Between 2024 and 2025, malaria diagnostic utilization among patients tested at various health facility levels across Uganda revealed distinct patterns. At Health Centre III, mRDTs accounted for 83.9% of malaria tests in 2024 and 84.6% in 2025. Similarly, Health Centre IV facilities maintained high utiilisation on mRDTs, with 70.5% in 2024 and 70.78% in 2025. In contrast, Regional Referral Hospitals, demonstrated a shift toward microscopy, increasing from 47.7% in 2024 to 52.9% in 2025 (Figure 2).
Malaria diagnostic utilisation by facility ownership, Uganda, 2024–2025
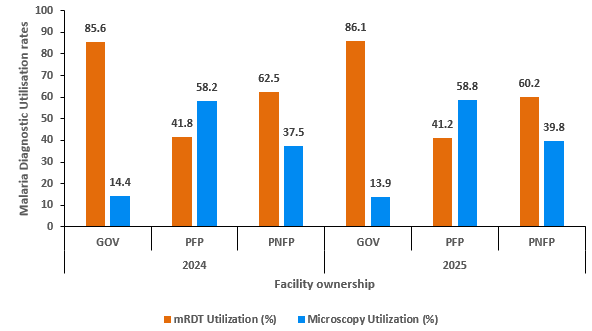
Between 2024 and 2025, malaria diagnostic utilization among patients tested in Uganda’s health facilities of different ownership categories showed clear contrasts. In government facilities, mRDTs accounted for 85.6% of malaria tests in 2024 and 86.1% in 2025, In contrast, private‑for‑profit facilities, malaria microscopy was the highest with 58.2% in 2024 and 58.8% in 2025. Private not‑for‑profit facilities, showed intermediate microscopy utilization, rising from 37.5% in 2024 to 39.8% in 2025 (Figure 3).
Regional utilisation of malaria diagnostics, Uganda, 2024-2025
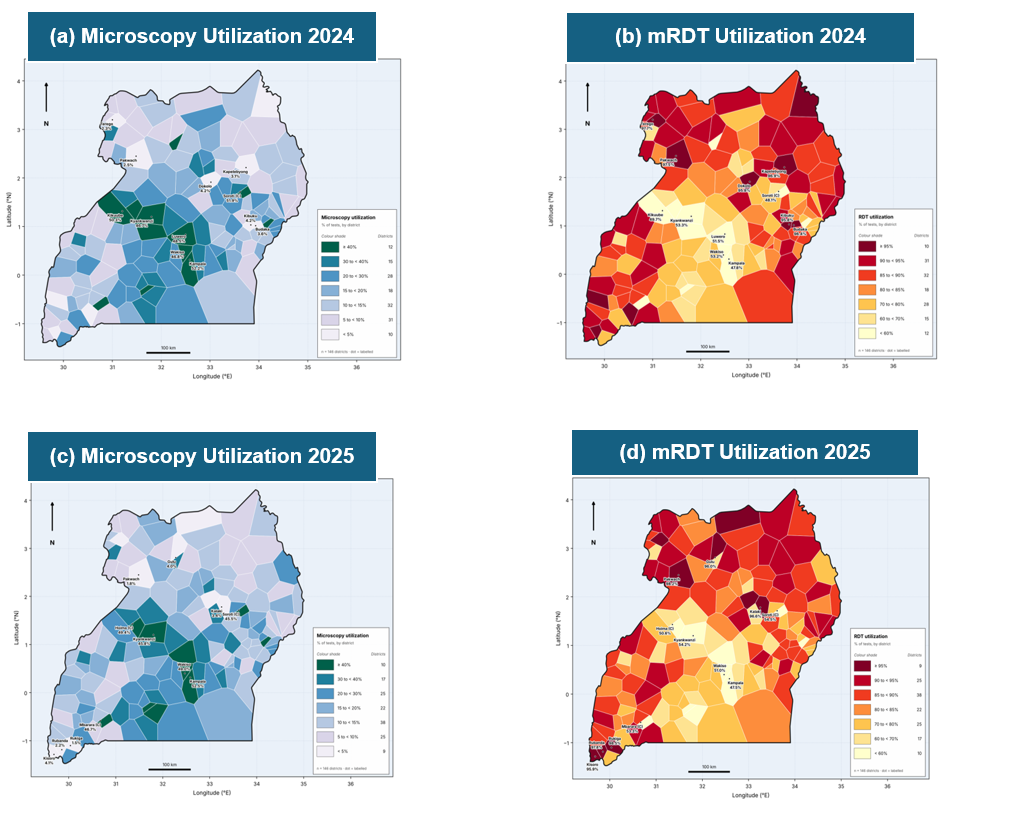
In 2024 and 2025, malaria diagnostic practices among patients tested across Uganda’s districts and health facilities were dominated by Rapid Diagnostic Tests (mRDTs), though regional and facility‑level disparities was notable. Northern and Western Uganda consistently reported the highest mRDTs utilisation (>80%), while Eastern Uganda showed moderately high uptake (>75%). In Central Uganda’s urban districts (Kampala, Masaka, Rakai), mRDT use was lower (50–70%), Microscopy utilisation varied widely in 2024, districts such as Mubende, Fort Portal, and Mbarara recorded the highest uptake (>40%), while many rural districts remained below 30%. In 2025, microscopy remained significant in some districts (e.g., Ibanda, Mubende, Mbarara, Masaka, Kampala, all >45%), moderate in others (e.g., Rukungiri, Gulu ≈40%), and very low in places like Kabarole (<20%) (Figure 4).
Discussion
Analysis of DHIS2 data from 2024–2025 showed that mRDTs remained the predominant malaria diagnostic method in Uganda, accounting for about four in five reported tests. Their greater use, particularly at lower-level facilities, likely reflects their accessibility and ease of use where laboratory capacity is limited. Increased mRDT use in 2025 alongside declining microscopy use indicates continued reliance on rapid testing despite national guidance supporting complementary use of microscopy(5–8).
Diagnostic utilization varied by facility level and ownership. Health Centre III and IV facilities relied more on mRDTs, while Regional Referral Hospitals reported greater microscopy use, consistent with stronger laboratory capacity. Government facilities used mRDTs more frequently, whereas private-for-profit facilities reported greater microscopy use. These differences may reflect variation in laboratory capacity, staffing, equipment, supplies, and service delivery(5,6).
Regional differences were also evident, with higher mRDT use in Northern and Western Uganda and lower use in parts of Central Uganda, including Kampala and Masaka. These findings demonstrate the value of DHIS2 diagnostic-utilization indicators for identifying areas requiring further assessment and targeted laboratory support(9).
Study limitations: The analysis relied on routinely reported DHIS2 data and was therefore subject to reporting completeness and accuracy. Aggregated data limited assessment of patient-level characteristics and outcomes. In addition, the analysis describes diagnostic utilization but cannot determine why a particular method was used or establish causal relationships with equipment, staffing, supplies, or workload. Operational assessments are therefore needed to better understand the observed patterns.
Conclusion: Malaria RDTs dominated malaria diagnosis in Uganda during 2024–2025, accounting for approximately four in five reported tests. Utilization varied substantially by facility level, ownership, and region, with particularly high mRDT reliance at Health Centre III and IV facilities and greater microscopy use at Regional Referral Hospitals and private-for-profit facilities. Routine DHIS2 diagnostic-utilization indicators can help identify gaps and guide targeted strengthening of malaria diagnostic services.
Microscopy capacity should be strengthened at facilities where it is expected to be available through functional equipment, adequate supplies, competent staff, maintenance, and quality assurance. Routine DHIS2 indicators should be used to identify facilities with unusually high mRDT reliance or low microscopy utilization for targeted supportive supervision. Where microscopy capacity exists but use remains low, staffing, workload, and workflow constraints should be assessed. Government, PNFP, and PFP facilities should all be included in diagnostic-strengthening efforts, while targeted operational assessments should investigate the reasons for low microscopy utilization and guide corrective action.
Conflict of Interest: The authors declare no conflict of interest
Author contribution: FNM took lead in conceptualizing the project, data abstraction, analysis and original draft writing. All authors GS, AW, and EA read and approved the final draft.
Acknowledgements: The authors appreciate the Ministry of Health for providing access to DHIS2 data that was used for this analysis.
Copyrighting and licensing: All material in the Uganda Public Health Bulletin is in the public domain and may be used and printed without permission. However, citation as to source is appreciated. Any article can be reprinted or published. If cited as a reprint, it should be referenced in the original form.
References
- Annual Health sector performance report FY 24-25 [Annual report] [Internet]. Available from: https://guluhospital.net/document/annual-health-sector-performance-report-2024-25
- World Health Organization. WHO guidelines for malaria, 13 August 2025 [Internet]. World Health Organization; 2025 [cited 2026 Aug 13]. Available from: https://iris.who.int/handle/10665/382254 doi:10.2471/B09514
- MALARIA-REDUCTION-AND-ELIMINATION-STRATEGIC-PLAN-2021-2025.
- Global Malaria Programme operational strategy 2024-2030.
- Kigozi RN, Bwanika J, Goodwin E, Thomas P, Bukoma P, Nabyonga P, et al. Determinants of malaria testing at health facilities: the case of Uganda. Malar J. 2021 Dec 4;20(1):456. doi:10.1186/s12936-021-03992-9 PubMed PMID: 34863172; PubMed Central PMCID: PMC8645102.
- Kyabayinze DJ, Achan J, Nakanjako D, Mpeka B, Mawejje H, Mugizi R, et al. Parasite-based malaria diagnosis: are health systems in Uganda equipped enough to implement the policy? BMC Public Health. 2012 Aug 24;12:695. doi:10.1186/1471-2458-12-695 PubMed PMID: 22920954; PubMed Central PMCID: PMC3490993.
- Batwala V, Magnussen P, Nuwaha F. Comparative feasibility of implementing rapid diagnostic test and microscopy for parasitological diagnosis of malaria in Uganda. Malar J. 2011 Dec 19;10:373. doi:10.1186/1475-2875-10-373 PubMed PMID: 22182758; PubMed Central PMCID: PMC3269399.
- Kigozi SP, Kigozi RN, Sserwanga A, Nankabirwa JI, Staedke SG, Kamya MR, et al. Malaria Burden through Routine Reporting: Relationship between Incidence and Test Positivity Rates. Am J Trop Med Hyg. 2019 Jul;101(1):137–47. doi:10.4269/ajtmh.18-0901 PubMed PMID: 31074412; PubMed Central PMCID: PMC6609187.
- Nuwasiima S, Mpimbaza A, Muteebwa L, Nagawa E, Arinaitwe E, Kiberu F, et al. Concordance of data on key malaria indicators between DHIS2 and source documents, and influencing factors at public primary health facilities in eastern Uganda: a mixed methods study. Malar J. 2025 Aug 20;24(1):270. doi:10.1186/s12936-025-05519-y PubMed PMID: 40835928; PubMed Central PMCID: PMC12369219.

Comments are closed.