
HIV Viral Load Sample Delivery Times, Rejection Rates and Results Dispatch Turnaround Time, August 2014-July 2015, Uganda
Authors: 1,2 Lilian Bulage, 1Isaac Ssewanyana, 1,2 Okello Paul, 1 Aisu Stephen, 1 Charles Kiyaga; Affiliations: 1Central Public Health Laboratories, 2Public Health Fellowship Program-Field Epidemiology Track
Summary: Nationally, antiretroviral therapy (ART) monitoring using viral load (VL) as a gold standard commenced in August 2014 in Uganda. We described VL samples delivery times , results dispatch turnaround time (TAT), rejection rates, and major reasons for sample rejection at CPHL between August 2014 and July 2015 as part of continuous performance improvement for the centralized VL testing pro- gram. Samples from Karamoja region had the highest TAT followed by samples from the Western region. As the sample volumes increased over the time, even the sample delivery time increased. The laboratory results dispatch time was highest at the start of the program. However, as time went by, the laboratory gradually reduced the TAT despite the increasing sample volumes . 2% ( 2344/107609) of the submit- ted samples were rejected. Of the 2344 rejected samples, 93%(2179/2344) were rejected because of not meeting the sample quality criteria, 3%(63/2344) because of failure to complete the VL test lab request form with vital information and 4% (102/2344) because of patients not meeting the VL testing eligibility criteria. Expansion of the HUB and the VL programs should be critically thought about in line with all aspects likely to affect the desired outcomes. Additionally, standard operating procedures (SOPs) addressing good quality sample collection should be provided to sites. CPHL should routinely analyze and review sample quality trends and geographic hot spots for poor quality specimens. Results should routinely be disseminated to key stakeholders as part of routine supportive supervision and quarterly review meetings to facilitate improvement in specimen quality
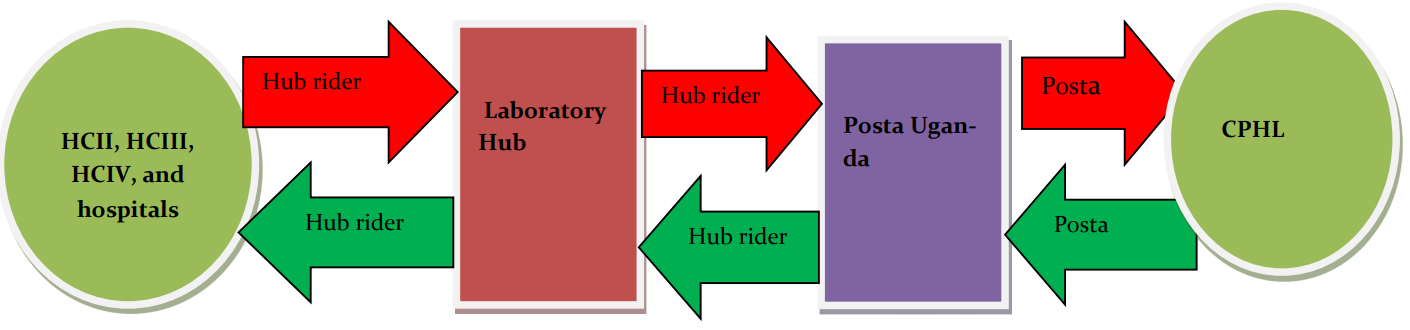
INTRODUCTION: In Uganda, monitoring response to Antiretroviral therapy (ART) using viral load (VL) as a gold standard nationally started in August 2014. Blood samples are collected from HIV-positive patients who have been on ART for at-least 6 months [1, 2]. Dried blood spots (DBS) and or plasma samples are referred from both government and private health facilities all over the country and transported to Central Public Health Laboratories (CPHL) through the national laboratory sample transport system, commonly known as the Hub system as illustrated in figure 1 [3]. Before samples are accepted for testing, they must meet the quality criteria otherwise they are rejected. The quality criteria include; sample must come from a patient who is eligible for VL testing; the request form accompanying the sample must have all data fields filled in appropriately; the sample itself must meet the pack- aging criteria, timeliness in transportation to CPHL, volume and appearance. According to the CPHL standard operating procedures. The DBS are put into a sealable plastic bag and desiccant packets and humidity cards added before sealing the bag Sealing the bag. Dried blood spots can be transported without cold-chain and remain stable for one month after collection [11, 12]. The whole pack is then put in a pre-labeled envelope ready for transportation.
DBS samples should not go beyond 14 days during transportation. Plasma storage and transport requires that plasma is transported within 24 hours at 25°C in EDTA tubes, or within 5 days at 4°C for EDTA tubes or PPT, after centrifugation. If there is no access to centrifugation, whole blood in EDTA tubes or PPT cannot be stored for more than 6 hours at 25°C. At least 0.75mls of plasma is required for the sample to be processed.
Laboratory testing: Two Polymerase chain reaction (PCR) based methods are used (Roche Molecular System and Abbott) for viral load testing at CPHL. The time to results is approximately 8 hours for both systems[4].Laboratory testing: Two Polymerase chain reaction (PCR) based methods are used (Roche Molecular System and Abbott) for viral load testing at CPHL.
The time to results is approximately 8 hours for both systems [4]. Laboratory testing: Two Polymerase chain reaction (PCR) based methods are used (Roche Molecular System and Abbott) for viral load testing at CPHL. The time to results is approximately 8 hours for both systems[4]. Given the infancy of the centralized VL testing program in Uganda, and the need to facilitate continued performance improvement of the program we carried out this operational assessment.


In this study, we estimated the delivery time for VL samples, laboratory results dispatch turnaround time (TAT), proportion of VL samples rejected, described major reasons for rejection of samples and described the relationship between sample volume and sample delivery time, sample volume and results TAT between August 2014 and July 2015.
METHODS:
We extracted data generated between August 2014 and July 2015 from the central viral load testing data base at CPHL. We defined Sample delivery time as number of days from when a sample is collected at the health facility to the day when the sample is received at CPHL. Laboratory results dispatch turnaround time (TAT) as number of days from when the sample is received at CPHL to the day when the results are dispatched to their respective health facilities.
RESULTS: Majority of DBS samples arrived at CPHL between 0-14 days while most plasma samples arrived within 2-5 days. Samples from Karamoja region had the highest TAT followed by samples from the Western region. As the sample volumes increased over the months, even the sample delivery time increased. 51% per- cent of the results were dispatched within a week’s time. The laboratory results dispatch time was highest at the start of the program. However, as time went by, the laboratory gradually reduced the TAT despite the increasing sample volumes as shown in figure 3.
2% ( 2344/107609) of the submitted samples were rejected. Of the 2344 rejected samples, 93% (2179/2344) were rejected be- cause of failure to complete the VL test lab request form with vital information and 4% (102/2344) because of patients not meeting the VL testing eligibility criteria. Under the sample quality criteria, main reasons for rejection included DBS being less than the required size (49.7%), haemolysed samples ( 13.6%), blood samples being older than 3 weeks ( 12.1%) among others. Dispatch days were highest at the start of the program. However, as time went by, the laboratory gradually reduced the TAT de- spite the increasing sample volumes.

Discussion: In this study, 89% of the DBS samples were delivered within the recommended 2 weeks time while as 30% of plasma samples were delivered within the recommend 24hrs.
The laboratory results dispatch TAT was highest at the start of the program. As time went by, the laboratory gradually reduced the TAT despite the increasing sample volumes. Our findings also reveal that, as the sample volume increased over time due to expansion of the program, the sample delivery time increased as well. This could be explained by the possibility of the program expanding in terms of number of health facilities/health workers trained and oriented to start sending samples while as its other aspects like staff to manage transportation remain constant. The quality of training and lack of follow up mentorships could be the other contributing factors. As expansion of the program is planned, all aspects including sample transportation should be critically thought about and planned for. Otherwise, we risk reaching a time whereby the sample volumes are too high and hence compromising the sample quality.
On the contrary, as the sample volume increases over time, we observe the laboratory results TAT remaining under check. This could be explained by the laboratory putting in place extra measures to counteract the impact of the increasing sample volumes. Night and week- end shifts have played a big role in controlling of the TAT. Sometimes there is shift of staff from sections with less work to overloaded sections in order to reduce the overall results dispatch time. 93% of rejections were due to samples failing to meet the sample quality criteria. This may be attributed to the limited information about VL sample quality amongst health workers who do the actual sample collection and packaging. This may as well depend on to the selection of the people to be trained, sometimes the people trained, are not the ones who do actual sample collection and packaging. The quality of training and lack of follow-up mentorship may be contributory.
Recommendations. We recommend some operational changes like immediate feedback to health facilities sending poorly collected samples, through phone calls indicating reasons for rejection. Understand challenges providers face in ensuring that a good quality sample is obtained and trans- ported accordingly and provision of SOPs is crucial. Results should be disseminated at to key stakeholders routinely to facilitate improvement in specimen quality.
Comments are closed.