
Trends and Spatial Distribution of all-cause Mortality, Uganda, 2018–2023
Authors: Joyce Owens Kobusingye1*, Edith Namulondo1, Emmanuel Mfitundinda1, Stella Lunkuse2, Patricia Eyu1, Hilda Tendo Nansikombi1, Lilian Bulage1, Richard Migisha1, Benon Kwesiga1, Alex Riolexus Ario1 Institutional affiliations: 1Uganda Public Health Fellowship Program, Uganda National Institute of Public Health, Kampala, Uganda; 2Integrated Epidemiology Surveillance and Public Health Emergencies, Ministry of Health, Kampala, Uganda, 3United States Center for Disease Prevention and Control *Correspondence: Tel: +256774767115 Email: jokusingye@uniph.go.ug
Summary
Background: All-cause mortality statistics are vital for health planning and policy formulation and planning. The 2019 report from National Identification and Registration Authority shows that only 1% deaths are notified annually. We described the trends and spatial distribution of all-cause mortality data, 2018–2023, to inform Ministry of Health of the need to implement disease specific interventions in regions.
Methods: We analyzed secondary data from the District Health Information Software 2 and the 2022 Uganda Demographic and Health Survey for mortality data of 2018–2023. We abstracted mortality data at national level on all-cause mortality by age, sex, and admission. We calculated the crude death rate, described the leading all-cause mortality, calculated all-cause mortality rates per 100,000 population, and established the trends in distribution and its significance using the Mann Kendall test.
Results: Malaria was the leading cause of mortality among all age groups accounting for an average of 10% (28,000/290,325) followed by neonatal conditions 8% (23,871/290,325) registered deaths during the study period. Malaria cases increased from 358/100,000 in 2018 to 388/100,000 in 2023 (p=0.08). Kampala Region consistently registered high mortality rates across the six years: 2018 (641/100,00), 2019 (683/100,000), 2020 (723/100,000), 2021 (645/100,000), 2022 (609/100,000), and 2023 (712/100,000). Lango Region consistently registered low mortality rates from 43/100,000 in 2018 to 55/100,000 in 2023 (p=0.02).
Conclusion: Our analysis underscores the persistent challenge of malaria as a top cause of mortality in Uganda. The consistently high mortality rates in Kampala and the significant rise in Karamoja and Busoga region emphasize the need for region-specific interventions. Targeted interventions to improve neonatal care and strengthen malaria control are crucial to reducing mortality and enhancing regional health outcomes.
Background
Cause-mortality is a measure of the total number of deaths from any cause in a population over a specific period of time (1, 2). Uganda like other Sub Saharan African countries has been crippled by both communicable and non-communicable diseases that have resulted in high rates of morbidity and mortality and impacted the health system greatly. Studies have been conducted globally on cause of mortality: malaria, measles, E. coli, and tuberculosis (TB) but few studies have examined the major causes of morbidity and mortality in Uganda (3). Many of them have focused on individual diseases of interest (3). To report statistics on causes of mortality in any country, vital statistics have to be registered and notified from health facilities and the community (4). We described the trends and spatial distribution of causes of mortality surveillance data, 2018–2023, to inform Ministry of Health of the need to implement disease specific interventions in regions.
Methods
Study design, setting, and data source
We conducted a descriptive analysis of all-cause mortality surveillance data generated from all the healthy facilities in Uganda through the District Health Information System 2 (DHIS2), 2018-2023.
The World Health Organization (WHO) rolled out the implementation of the Medical Notification and Certification of Cause of Death (MCCoD) in 2021 but the overall death certification remains low at 11% at health facilities. Most of the mortality data captured in the DHIS2 is not medically certified. Regional population statistics were obtained from the 2022 UDHS report and these were used to calculate the crude death rates and regional mortality rates. Data is captured at different levels using different tools. At health facility level: when death occurs, the designated HCW completes the MCCoD, code named HMIS Form 100 to notify death, and to certify cause of death (CoD) and thereafter data is entered into DHIS2. At community level: community health workers (CHEWs) notify death after receiving notifications from community leaders or household member using the HMIS 097b report which is later captured into the DHIS2. The CHEWs also use the electronic Community Health Information System (eCHIS) which is linked to the DHIS2 although this system is only operating in 17 districts. Verbal autopsy is also used to determine CoD through interviews with the deceased’s next of kin or caregivers when a notification is received.
Study variables and data analysis
We abstracted annual mortality surveillance data from DHIS2 on all-cause mortality, 2018–2023, for data on age, sex, admissions, number of deaths at health facilities. We calculated the crude mortality rate as the total number of deaths by mid-year population per 100,000 for the study period. We described the top five leading causes of mortality among all age groups for the study period. We calculated mortality rates for all causes of mortality as a ratio of total deaths (numerator) by total population per region (denominator) per 100,000 and described their annual trends. We used the Mann Kendall test of seasonality and significance to determine the trends and described spatial distribution mortality across the 15 regions using choropleth maps to show the most affected regions per year.
Ethical considerations
Our study utilized routinely aggregated surveillance data with no personal identifiers in health facility outpatient and in-patient monthly reports, obtained from the DHIS2. The Uganda Public Health Fellowship Program is part of the National Rapid Response Team and has been granted permission to access and analyze surveillance data in the DHIS2 and other data such as survey and field investigation data to inform decision-making in the control and prevention of outbreaks and public health programming. Additionally, the Ministry of Health granted the program permission to disseminate the information through scientific publications. We stored the abstracted dataset in a password-protected computer and only shared it with the investigation team.
Results
Trends in crude mortality rate, Uganda, 2018–2023
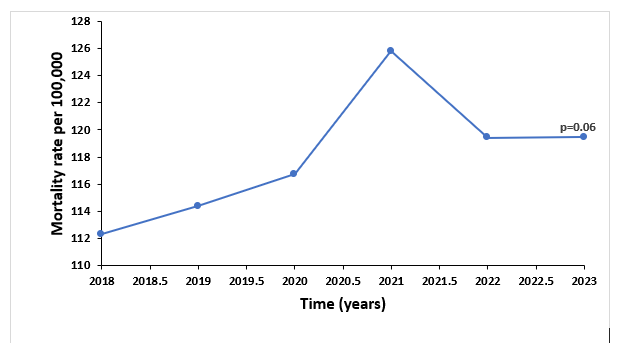
The crude death rate was 649/100,000 population with a total of 290,325 deaths registered during the study period. There was a non-significant increase (p=0.06) in crude mortality rate from 112/100,000 persons in 2018 to 119/100,000 in 2023 (Figure 1).
Trends in crude mortality rate, Uganda, 2018–2023
The crude death rate was 649/100,000 population with a total of 290,325 deaths registered during the study period. There was a non-significant increase (p=0.06) in crude mortality rate from 112/100,000 persons in 2018 to 119/100,000 in 2023 (Figure 1).
Description of leading all-cause mortality, Uganda, 2018–2023
Trends of leading all-cause mortality, Uganda, 2018–2023
Among all age groups
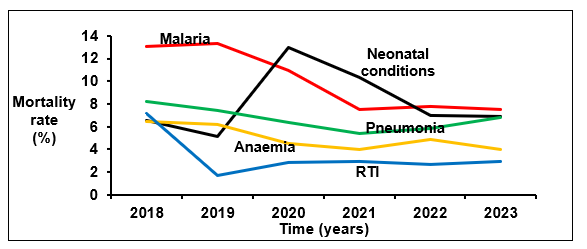
In all the years studied children <5 years were the most affected by different all-cause mortalities accounting for 7.0% in deaths. Malaria was the leading cause of mortality accounting for an average of 10% (28,000/290,325) followed by neonatal conditions with an average of 8% (23,871/290,325) of all mortalities registered during the study period. There was an increase in all-cause mortality rates for malaria and neonatal conditions with no significant trend (p=0.13) during the study period (Figure 2). Malaria mortality rates increased from 13% to 8% (p=0.13) and neonatal conditions increased from 6.5% to 6.8% (1), Similarly, there was a decrease in mortality rates for pneumonia, anaemia and road traffic accidents but with no significant trend. Pneumonia mortality rates decreased from 8.2% to 6.8% (p=0.25), anaemia from 6.5% to 4.0% (p=0.13) and RTA from 7.1% to 2.9% (p=1).
Among children Under-5 years
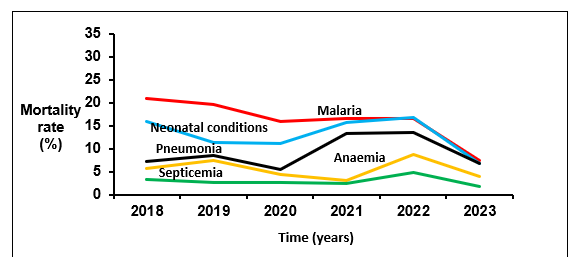
Malaria was the leading cause of mortality among children <5 years over the six-year period ranging from 11%–18%, followed by neonatal conditions that declined from 16% in 2018 to 6.8%% in 2023 with no significant trend (p=0.7), pneumonia from 7.2% to 6.8%, (p=0.7), anaemia from 5.7% to 4.0% (p=0.7) and septicemia from 3.3% to 1.8%, (p=0.3) (Figure 3). Malaria cases increased from 358/100,000 in 2018 to 388/100,000 in 2023 although there was a notable non-significant decreasing trend in the same period (p=0.08) among children <5 years.
Spatial distribution of mortality rates by region, Uganda, 2018–2023
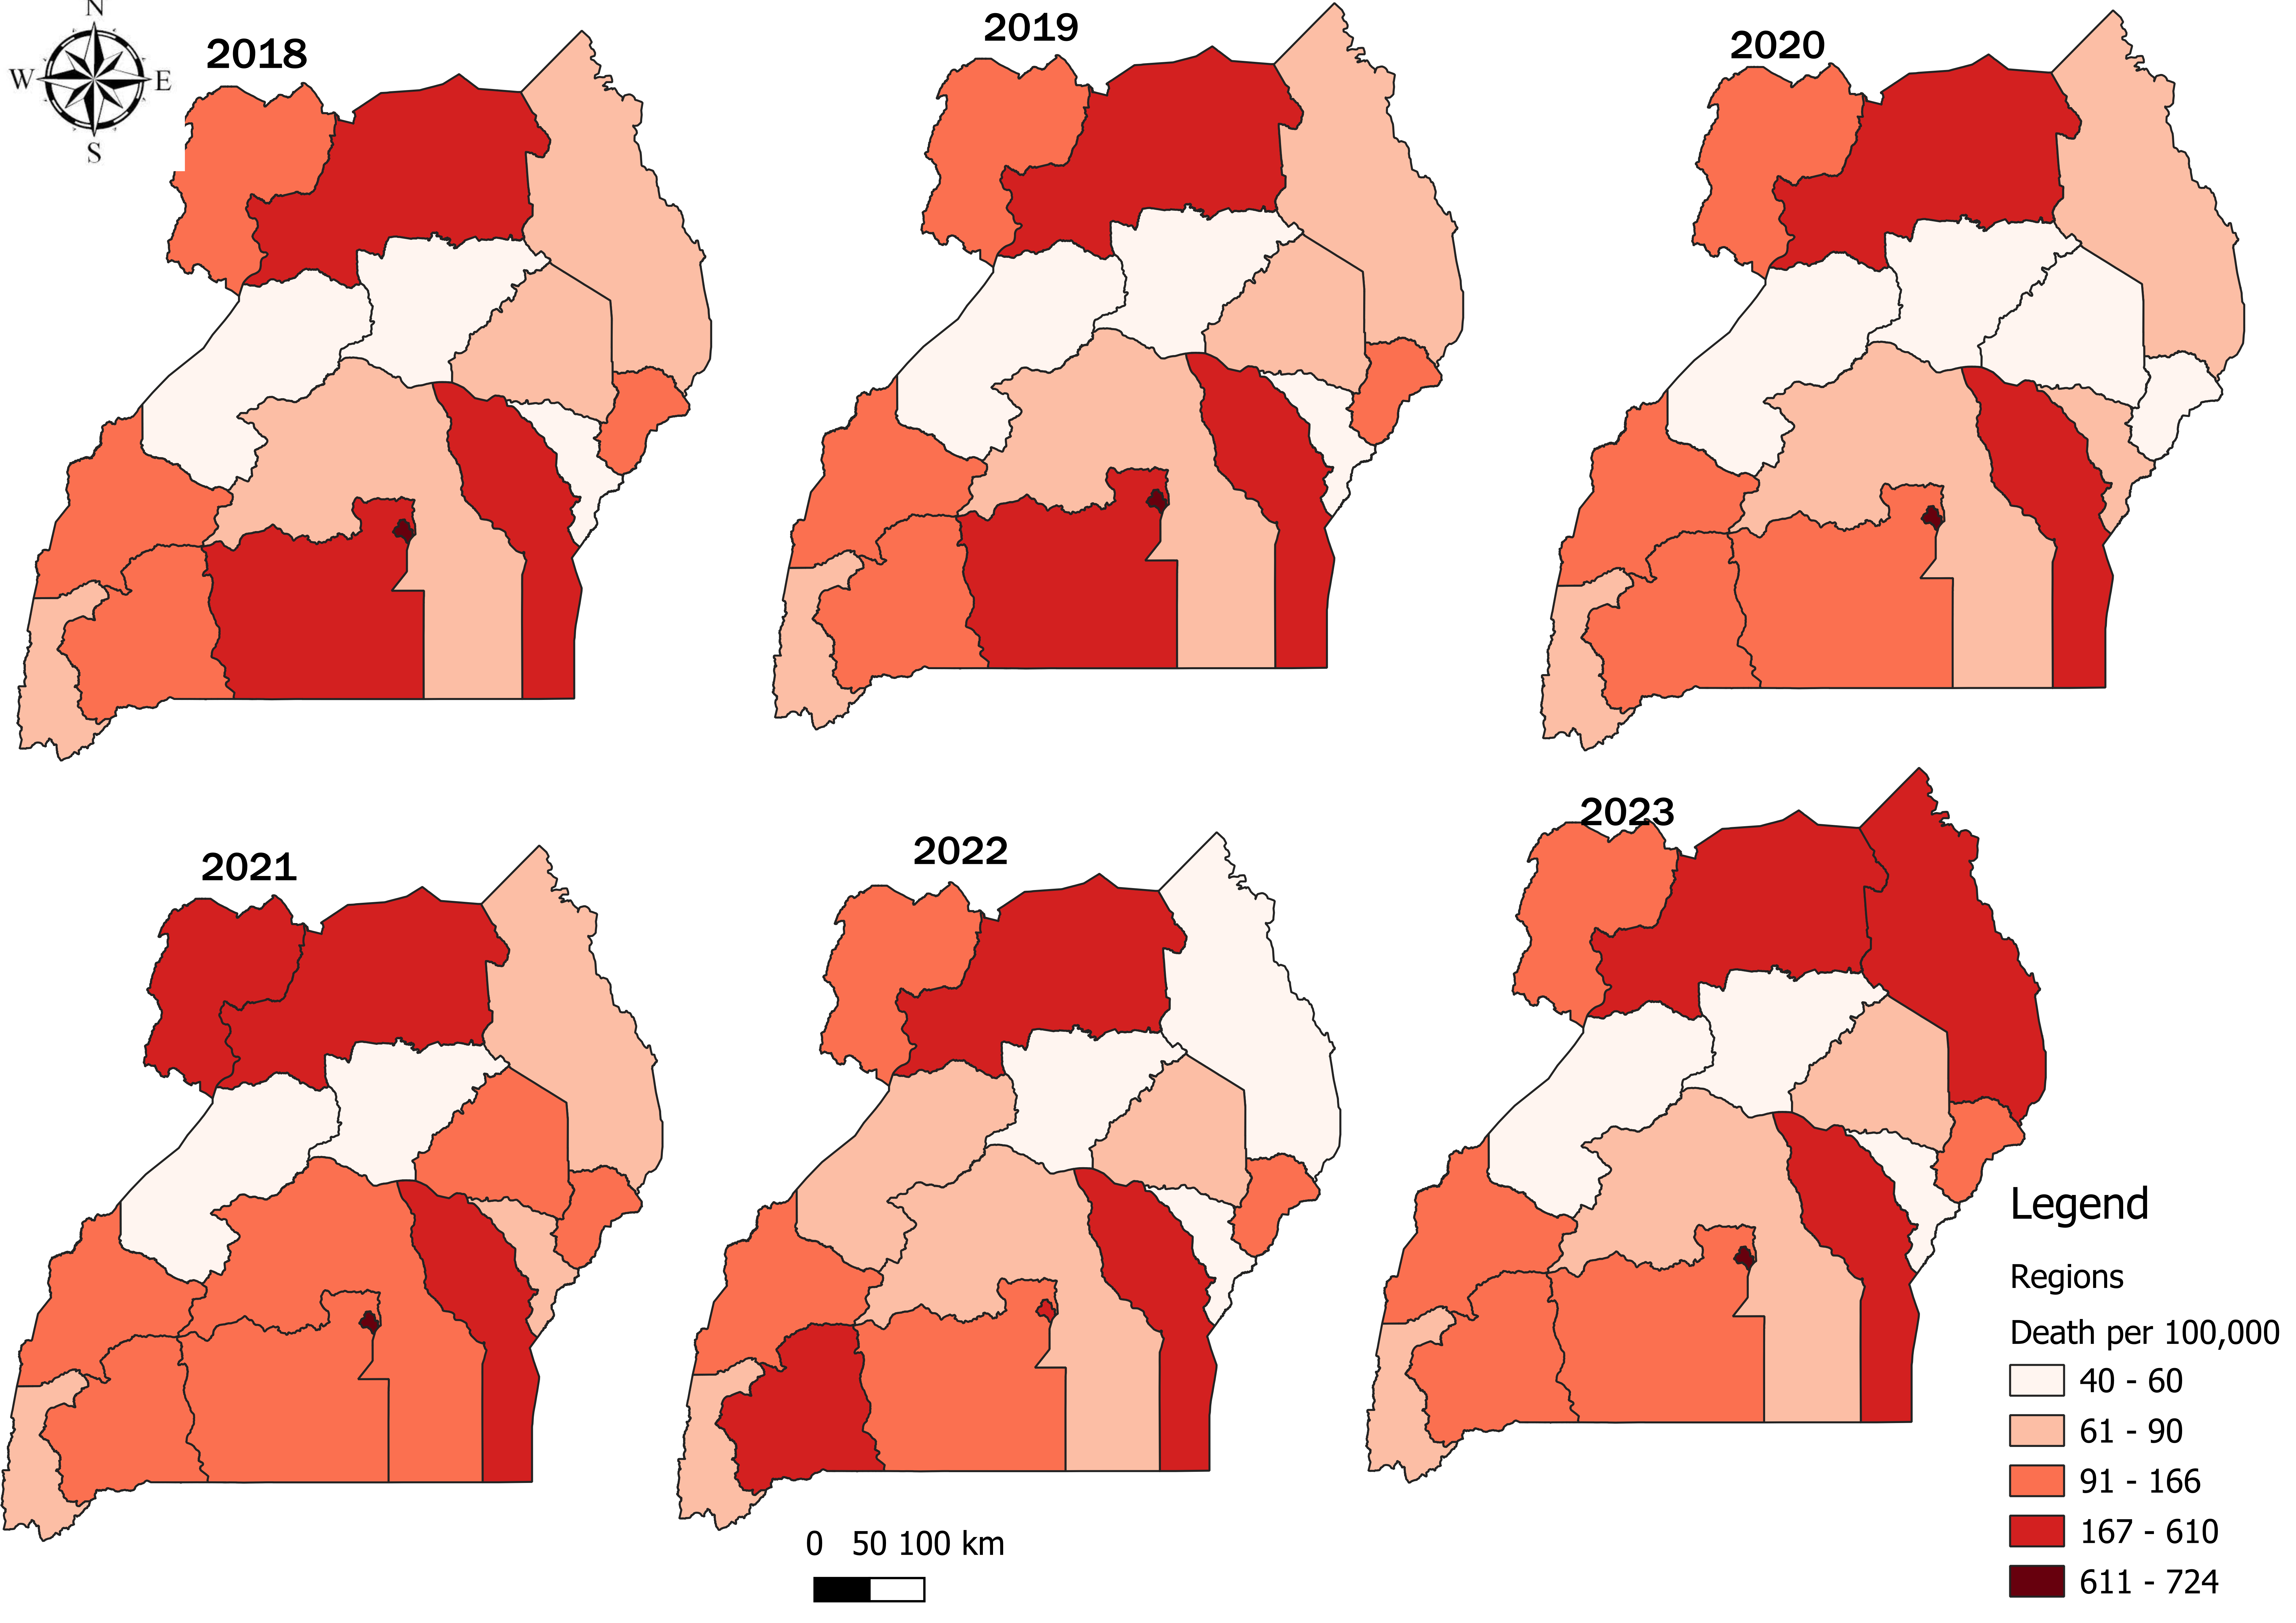
Kampala Region consistently registered high mortality rates across the six years with the highest mortalities (723/100,000) registered in 2020 and the lowest in 2022 (609/100,000) (Figure 4). Lango region consistently registered low mortality rates with the lowest rate (43/100,000) registered in 2018 (Figure 4). However, there was a steady increase in mortality rates in regions like Karamoja and Busoga.
Discussion
The crude mortality rate for the study period was 649/100,000 population. There was a general increase in the total number of deaths across the six-year period attributed to malaria and neonatal conditions among all age groups with more deaths registered 2023. The leading CoD: Malaria, neonatal conditions, pneumonia and road traffic accidents among all age groups. However, among children <5 years malaria and neonatal conditions were the major CoD. Stroke and cardiovascular conditions continued to account for low mortality rates. Kampala Region consistently registered high mortality rates across the six years. Lango Region consistently registered low mortality rates However, there was a steady increase in mortality rates in regions like Karamoja and Busoga.
There was an increase in the number of reported deaths over the six-year period among all age groups with more mortalities attributed to malaria and neonatal conditions. Increase in mortality both 2020 and 2021 can be attributed to the interruption of health service delivery and other associated consequences of COVID-19 outbreak (12). Some of these include, fear of movement to get infected, restrictions, long distances given lack and or inadequate means of transport to healthcare facilities. Similar to this study, a systematic review in 2021 estimated an increase in global mortality as a result of COVID-19 at 18.2 million while United States of America, there was a remarkable increase in CoD mostly among older adults, 25–44 years as a result of unintentional drug overdoses (13) (14).
There were differing proportions of death across all 15 regions, with some regions like Kampala registering high mortality rates and Lango registering low. This difference in distribution is attributed to the differing burden of disease in the regions that can be linked to differences in healthcare services and health seeking behaviors; availability and accessibility at different points of care (15).
In this study, neonatal conditions: neonatal sepsis 0-7 days, preterm baby and birth asphyxia were the leading causes of mortality among children <5 years in 2020-2023. Although these varied in different regions, there was a significant decline over the three years and this can also be attributed to a number of improvements in maternal service delivery at healthcare facilities: improved antennal attendance by expectant mothers, delayed cord clamping and kangaroo practices (20) (21) (22). Similarly, the 2021 UDHS report showed neonatal mortality decreased from 33 deaths per 1,000 live births in 2000-2001 to 22 deaths per 1,000 live births in 2022 (23).
Study limitations
Mortality data captured in DHIS2 is incomplete, with most of it not medically certified. Registration of Persons Act (ROPA) 2015 mandates that registration of every death within Uganda is compulsory and a MCCOD must be issued. Use of data in the DHIS may result in under-estimation or over-estimation of mortality statistics for a given cause of mortality. Secondly, descriptive analysis of routinely reported surveillance data is liable to reporting biases: delays in reporting and or non-reporting, and notification of death at health facilities which causes under-estimation of vital statistics that we experienced in this analysis.
Conclusion
Overall, there was a declining trend in mortality rates across the six years although a notable rise was seen in 2021. Our analysis underscores the persistent challenge of malaria and neonatal conditions as a top cause of mortality among all ages. The consistently high mortality rates in Kampala Region emphasizes the need for disease and region-specific interventions. Targeted interventions to improve implementation of malaria control measures and neonatal care are crucial to reducing mortality and enhancing regional health outcomes across all age groups and regions.
Increasing the proportion of trained HCW who can correctly diagnose, certify and notify death would go a long way to improve the quality of mortality data captured to be able to identify trends and patterns in mortality that might signal evolving health challenges among populations. Additionally, capturing death using the MCCoD upon death of a patient should be mandatory at the health facility.
Competing interests
The authors declare that they had no conflict of interest.
Author Contribution
JOK: Participated in the conception, design, analysis, and interpretation of the study and drafted the article and bulletin; EN participated in the conception of the study; EM participated in the analysis; RM, HTN, PE, and SL reviewed the report, HTN reviewed the article for intellectual content, and made multiple edits to the draft bulletin; BK and ARA reviewed the manuscript to ensure intellectual content and scientific integrity. All authors read and approved the final bulletin.
Acknowledgments
The authors thank the staff of the Public Health Fellowship Program for the technical support and guidance offered during this study. The authors also extend their appreciation to Ministry of Health for giving access to data that was used for the analysis.
Copyright and licensing
All materials in the Uganda Public Health Bulletin are in the public domain and may be used and reprinted without permission. However, citation as to source is appreciated. Any article can be reprinted or published. If cited as a reprint, it should be referenced in the original form.
References
- Principles of Epidemiology | Lesson 3 – Section 3 [Internet]. 2023 [cited 2025 Mar 4]. Available from: https://archive.cdc.gov/www_cdc_gov/csels/dsepd/ss1978/lesson3/section3.html
- All Cause Mortality – an overview | ScienceDirect Topics [Internet]. [cited 2024 Oct 14]. Available from: https://www.sciencedirect.com/topics/pharmacology-toxicology-and-pharmaceutical-science/all-cause-mortality?__cf_chl_tk=O4H9tzVug0gj9ZJzA_QJQZgWuhsWCMnG1QMCtmVb7RM-1728902625-1.0.1.1-.cpY5wkpY42ap9XFx.ZUiLxjSbieb4szYdgKuFBt6tw
- Namutebi AMN, Kamya MRK, Byakika-Kibwika P. Causes and outcome of hospitalization among HIV-infected adults receiving antiretroviral therapy in Mulago hospital, Uganda. Afr Health Sci. 2013;13(4):977–85.
- Atuhaire LK, Nansubuga E, Nankinga O, Nviiri HN, Odur B. Prevalence and determinants of death registration and certification uptake in Uganda. PLOS ONE. 2022 Mar 4;17(3):e0264742.
- CDC. Suicide Prevention. 2025 [cited 2025 Mar 4]. Suicide Data and Statistics. Available from: https://www.cdc.gov/suicide/facts/data.html
- Country Disease Outlook, Uganda [Internet]. [cited 2024 Sep 9]. Available from: https://www.afro.who.int/sites/default/files/2023-08/Uganda.pdf
- UDHS_2022_Key_Findings_Presentation_B.pdf [Internet]. [cited 2024 Jun 26]. Available from: https://www.ubos.org/wp-content/uploads/publications/09_2023UDHS_2022_Key_Findings_Presentation_B.pdf
- Prevalence and determinants of death registration and certification uptake in Uganda [Internet]. [cited 2024 Sep 17]. Available from: http://ouci.dntb.gov.ua/en/works/7XqML504/
- Annual Health Sector Performance Report 2020-21-1.pdf [Internet]. [cited 2024 Sep 14]. Available from: http://library.health.go.ug/sites/default/files/resources/Annual%20Health%20Sector%20Performance%20Report%202020-21-1.pdf
- Annual Health Sector Performance Report FY 20222023.pdf [Internet]. [cited 2024 Sep 14]. Available from: https://www.kamuli.go.ug/sites/files/Annual%20Health%20Sector%20Performance%20Report%20FY%2020222023.pdf
- National Mortality Surveillance Roadmap 2024-2028.pdf [Internet]. [cited 2024 Nov 22]. Available from: https://library.health.go.ug/sites/default/files/resources/National%20Mortality%20Surveillance%20Roadmap%202024-2028.pdf
- Annual Health Sector Performance Report 2020-21-1.pdf [Internet]. [cited 2024 Sep 14]. Available from: http://library.health.go.ug/sites/default/files/resources/Annual%20Health%20Sector%20Performance%20Report%202020-21-1.pdf
- Wang H, Paulson KR, Pease SA, Watson S, Comfort H, Zheng P, et al. Estimating excess mortality due to the COVID-19 pandemic: a systematic analysis of COVID-19-related mortality, 2020–21. The Lancet. 2022 Apr 16;399(10334):1513–36.
- Faust JS, Krumholz HM, Du C, Mayes KD, Lin Z, Gilman C, et al. All-Cause Excess Mortality and COVID-19–Related Mortality Among US Adults Aged 25-44 Years, March-July 2020. JAMA. 2021 Feb 23;325(8):785–7.
- Hopp LJ, Clementinah A, Verdick CJ, Napyo A. Annual burden of disease in Nakaale, Karamoja: A descriptive, cross-sectional study. PLOS Glob Public Health. 2022 Apr 26;2(4):e0000222.
- Supporting Uganda’s Malaria Reduction and elimination Strategy (sumres).pdf [Internet]. [cited 2024 Sep 14]. Available from: https://www.malariaconsortium.org/media-download-file/202201261145/supportingugandasmalariareductionandeliminationstrategysumres.pdf
- The effects and contribution of childhood diseases on the geographical distribution of all-cause under-five mortality in Uganda. Parasite Epidemiol Control. 2019 May 1;5:e00089.
- Trends-and-Distribution-of-Severe-Malaria-Cases-Uganda-2017–2021-Analysis-of-Health-Management-Information-System-Data.pdf [Internet]. [cited 2024 Sep 14]. Available from: https://uniph.go.ug/wp-content/uploads/2023/07/Trends-and-Distribution-of-Severe-Malaria-Cases-Uganda-2017%E2%80%932021-Analysis-of-Health-Management-Information-System-Data.pdf
- Niohuru I. Disease Burden and Mortality. In: Niohuru I, editor. Healthcare and Disease Burden in Africa: The Impact of Socioeconomic Factors on Public Health [Internet]. Cham: Springer International Publishing; 2023 [cited 2024 Sep 14]. p. 35–85. Available from: https://doi.org/10.1007/978-3-031-19719-2_3
- Babughirana G, Gerards S, Mokori A, Nangosha E, Kremers S, Gubbels J. Maternal and newborn healthcare practices: assessment of the uptake of lifesaving services in Hoima District, Uganda. BMC Pregnancy Childbirth. 2020 Dec;20(1):1–10.
- Nabatanzi M, Harris JR, Namukanja P, Kabwama SN, Nabatanzi S, Nabunya P, et al. Improving maternal and neonatal outcomes among pregnant women who are HIV-positive or HIV-negative through the Saving Mothers Giving Life initiative in Uganda: An analysis of population-based mortality surveillance data. PLOS Glob Public Health. 2024 Feb 1;4(2):e0002801.
- Nambuusi BB, Ssempiira J, Makumbi FE, Utzinger J, Kasasa S, Vounatsou P. Geographical variations of the associations between health interventions and all-cause under-five mortality in Uganda. BMC Public Health. 2019 Oct 22;19(1):1330.
- UDHS-2022-Report.pdf.pdf [Internet]. [cited 2024 Sep 14]. Available from: https://www.unicef.org/uganda/media/16731/file/UDHS-2022-Report.pdf.pdf
- Newborn survival in Uganda: a decade of change and future implications | Health Policy and Planning | Oxford Academic [Internet]. [cited 2025 Mar 6]. Available from: https://academic.oup.com/heapol/article/27/suppl_3/iii104/582795
- Newborn survival in Uganda: a decade of change and future implications | Health Policy and Planning | Oxford Academic [Internet]. [cited 2024 Sep 14]. Available from: https://academic.oup.com/heapol/article/27/suppl_3/iii104/582795
Comments are closed.