
Increasing trend in all–cause mortality at Regional Referral Hospitals in Uganda during the COVID–19 pandemic (2020–2021)
Authors: Sherry Rita Ahirirwe 1*, Andrew Kwiringira1, Benon Kwesiga1, Lilian Bulage1, Daniel Kadobera1, and Alex Riolexus Ario1 / Institutional affiliations: 1Uganda Public Health Fellowship Program, National Institute of Public Health, Ministry of Health, Kampala, Uganda / *Correspondence: Email: sahirirwe@musph.ac.ug, Tel: +256707064889
Summary

Background: Testing limitations and inadequate mortality surveillance systems complicate the analysis
 of data on the true burden of deaths associated with pandemics. One solution is to calculate excess
mortality (EM). We described temporal trends in all–cause mortality at regional referral hospitals
(RRHs) in Uganda and estimated EM during two years of the COVID19 pandemic compared with five years
of historical
data (2015–2019).

Methods: Monthly aggregate deaths, admissions, and reporting rates data were abstracted for 15 RRHs
from the Ministry of Health (MOH) District Health Information System (DHIS2), 2015–2021. We used
logistic regression to model temporal trends in all–cause mortality from 2015–2021. We estimated
EM, calculated in–hospital deaths/10,000 admissions in 2020 and 2021 and compared them to expected
levels using the upper bound of the 95%confidence interval of historical average (2015–2019).
Excess deaths were divided by expected deaths threshold to calculate EM percentage.

Results: With reference to 2015, there was a significant increase in all–cause mortality at RRHs
that more than doubled in 2021 (AOR=1.46, 95%CI = (1.42–1.50), p<0.001) compared to 2020 (AOR=1.20,
95%CI = (1.16–1.23), p<0.001).  EM at RRHs exceeded expected levels for six months in 2020: April
(7%), May (2%), June (25%), August (10%), October (4%), and November (4%). From June to November
2021, EM exceeded expected levels consecutively (57%, 25%, 22%, 1%, 10%, 6%). The highest EM peaks
were recorded in both years in June, but the peak in 2021 was double that of 2020. EM exceeded
expected levels at 13 (86%) of the 15 RRHs in 2021 and 11 (73%) in 2020.

Conclusion: There was a significantly increasing trend in all–cause mortality at RRHs during the
study period. EM at RRHs exceeded expected levels during the pandemic period when compared to
historical data. MOH can track the progression of epidemics in various regions using EM to inform
targeted control measures that avert preventable deaths caused by health system shocks.
Introduction
When the first case of Coronavirus Disease (COVID–19) was detected in Uganda, the government instituted control measures that comprised strong restrictions on movement (1). These stringent measures have been praised for the slow community transmission of COVID–19 at the beginning of the pandemic in Uganda (2). However, they led to lower utilisation of health services (3) including at Regional Referral Hospitals (RRHs) which were designated as COVID–19 treatment units (CTUs) (4).
Two main indicators were utilised for tracking the COVID–19 pandemic in countries, namely: the number of confirmed cases and the number of deaths (5) as these data are easy to measure and are readily available. However, identifying COVID–19 cases and deaths in Africa was a challenge due to limitations in testing (6) especially at the beginning of the pandemic. In Uganda, testing capacity increased over one year later, in June 2021 when Rapid Diagnostic Test kits (RDTs) became widely available (7). Tracking trends in illness and deaths caused by the virus was complicated by testing that was typically limited to priority groups such as healthcare workers, truck drivers, symptomatic and hospitalised cases as well as their contacts (7).
Thus, monitoring the pandemic’s trajectory requires the use of alternative analyses to complement available information. The World Health Organization (WHO) recommends monitoring the evolution of the pandemic using the total number of deaths irrespective of cause in order to overcome this challenge (8). Since this method includes not only confirmed deaths by COVID–19, it can help illustrate the direct and indirect impact of the COVID–19 pandemic. During the first wave of COVID-19 in Uganda, cases started peaking in August 2020 with a small peak recorded in September and the highest peak recorded in December 2020.
The second wave seen in 2021 peaked in the month of June and with the third wave starting to peak in December 2021. The strain on health systems caused by overwhelming cases of COVID-19 (9) may have contributed to higher overall mortality rates due to a lack of timely and adequate care for other health conditions at healthcare facilities. It is likely that we failed to capture deaths that occurred in the community as a result of patients’ fear of getting medical care owing to restrictions in movement (4). Excess deaths (ED) measures the difference in the reported number of deaths in the present year in comparison to historical data from previous years in a given population (8, 10). This can enable planners at Ministry of Health (MOH) to monitor the evolution of the pandemic at various hospitals and the impact of the pandemic control measures (8).
Morbidity and mortality data generated at healthcare facilities are collected and reported continuously through health management information system (HMIS) (11). Mortality data are readily available as they are aggregated on paper forms and entered into an online repository, namely: District Health Information System (DHIS2) (12, 13). Analysing all–cause mortality data can be the first step in detecting monthly excess deaths above normal expected levels (EL). We described temporal trends in all-cause mortality and the magnitude of excess deaths during two years of the COVID–19 pandemic to help quantify the burden of the pandemic in Uganda.
Methods
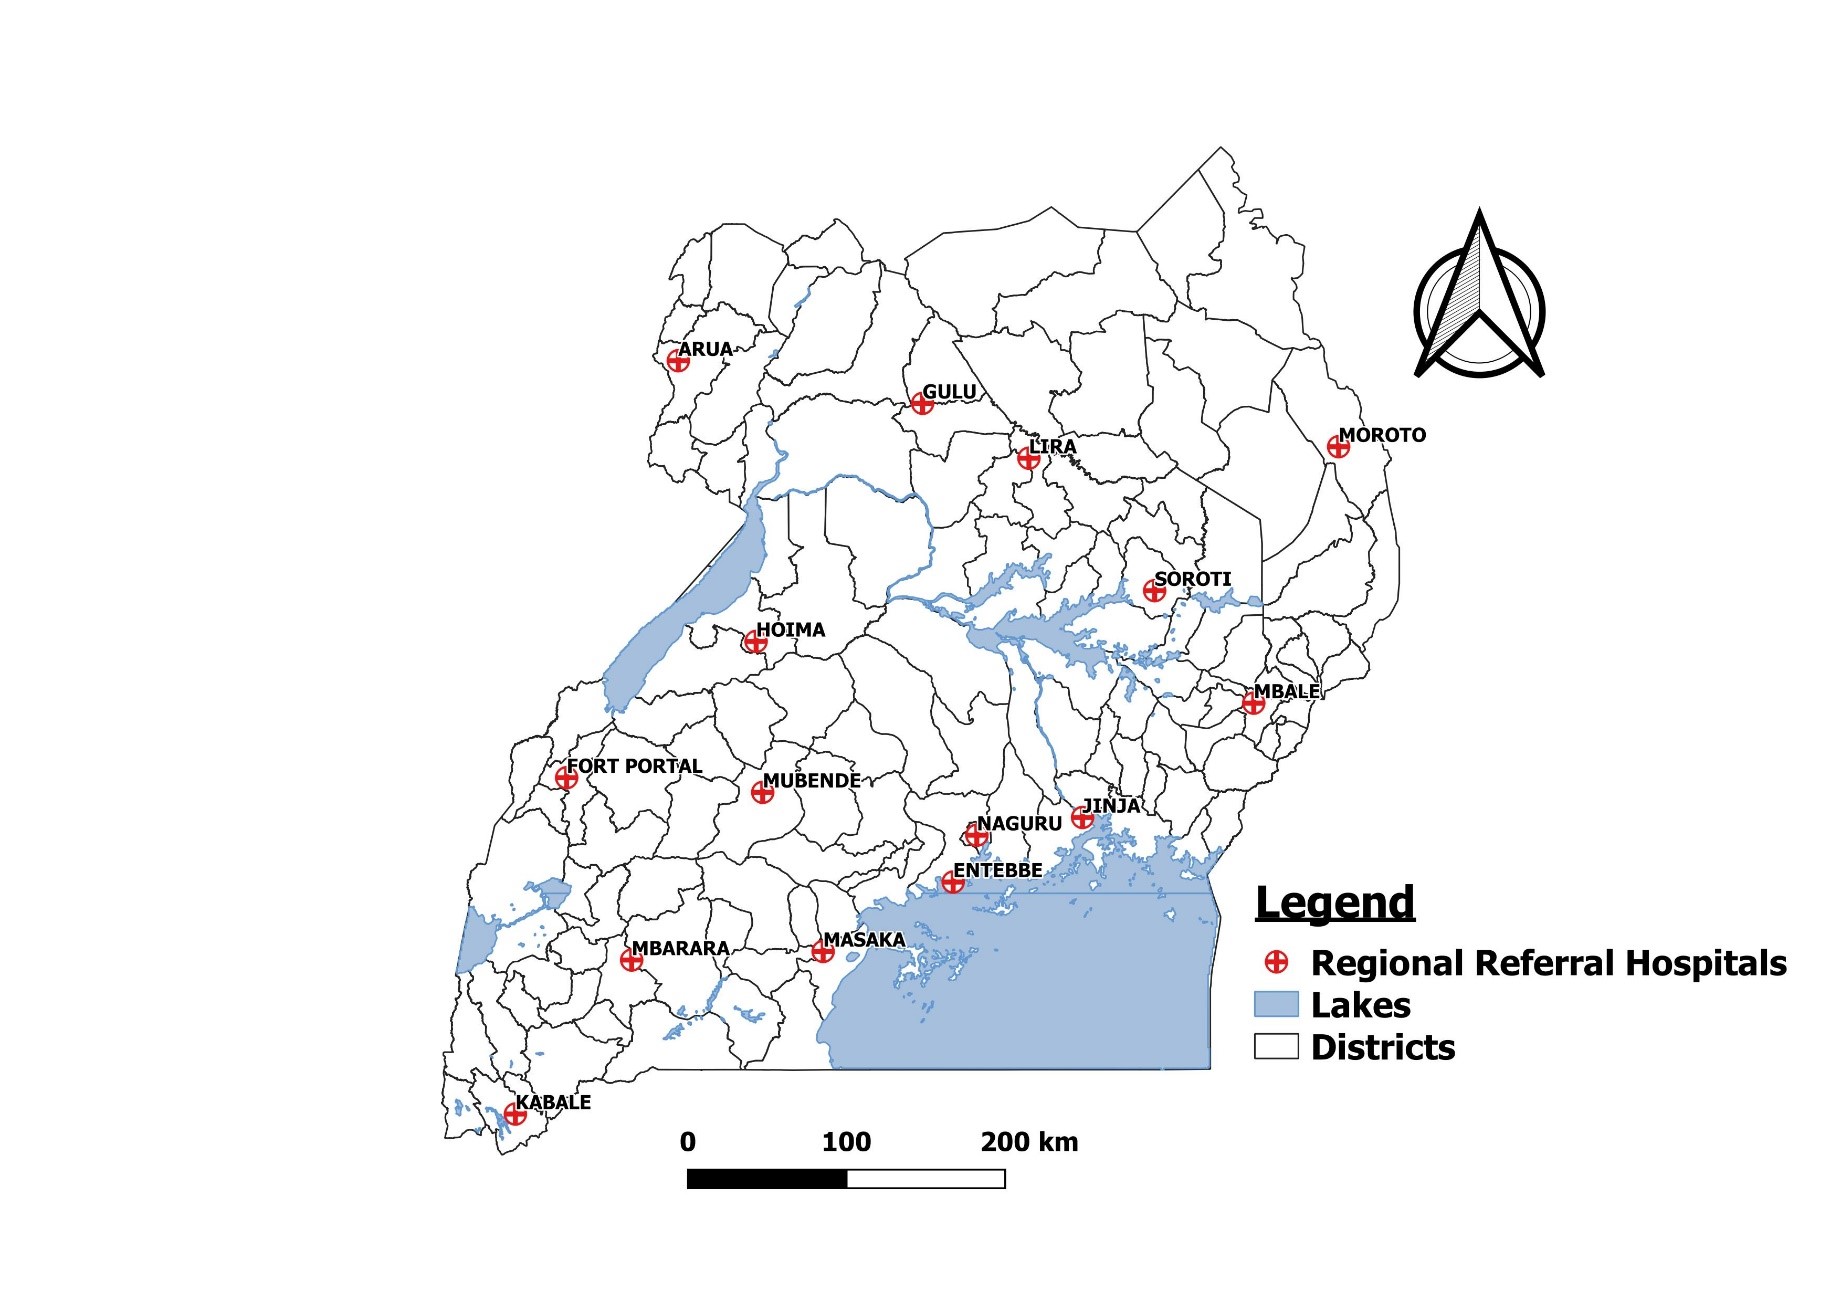
We conducted the study at 15 out of 17 RRHs in Uganda which were mandated to treat COVID-19 patients at the time. The other two hospitals were commissioned as regional referral hospitals in 2021 and 2022 but were excluded from this study since they did not offer regional referral services at the beginning of the pandemic in 2020. According to Uganda’s health system, RRHs are regionally located in sub-health zones and presumed to serve a population of 2 million people.
They provide referral services as well as specialised medical and surgical care that may not be available at the district level hospitals they supervise (14). At the onset of the pandemic in Uganda, RRHs were mandated to treat and manage COVID–19 patients because of their capacity and availability of services such as intensive care units (ICUs) or high dependency units (HDUs) that were lacking at other health facility levels. The 15 RRHs in this study included: Arua, Naguru, Entebbe, Fort Portal, Gulu, Hoima, Jinja, Kabale, Lira, Masaka, Mbale, Mbarara, Moroto, Mubende and Soroti (Figure 1).
Study design and data source
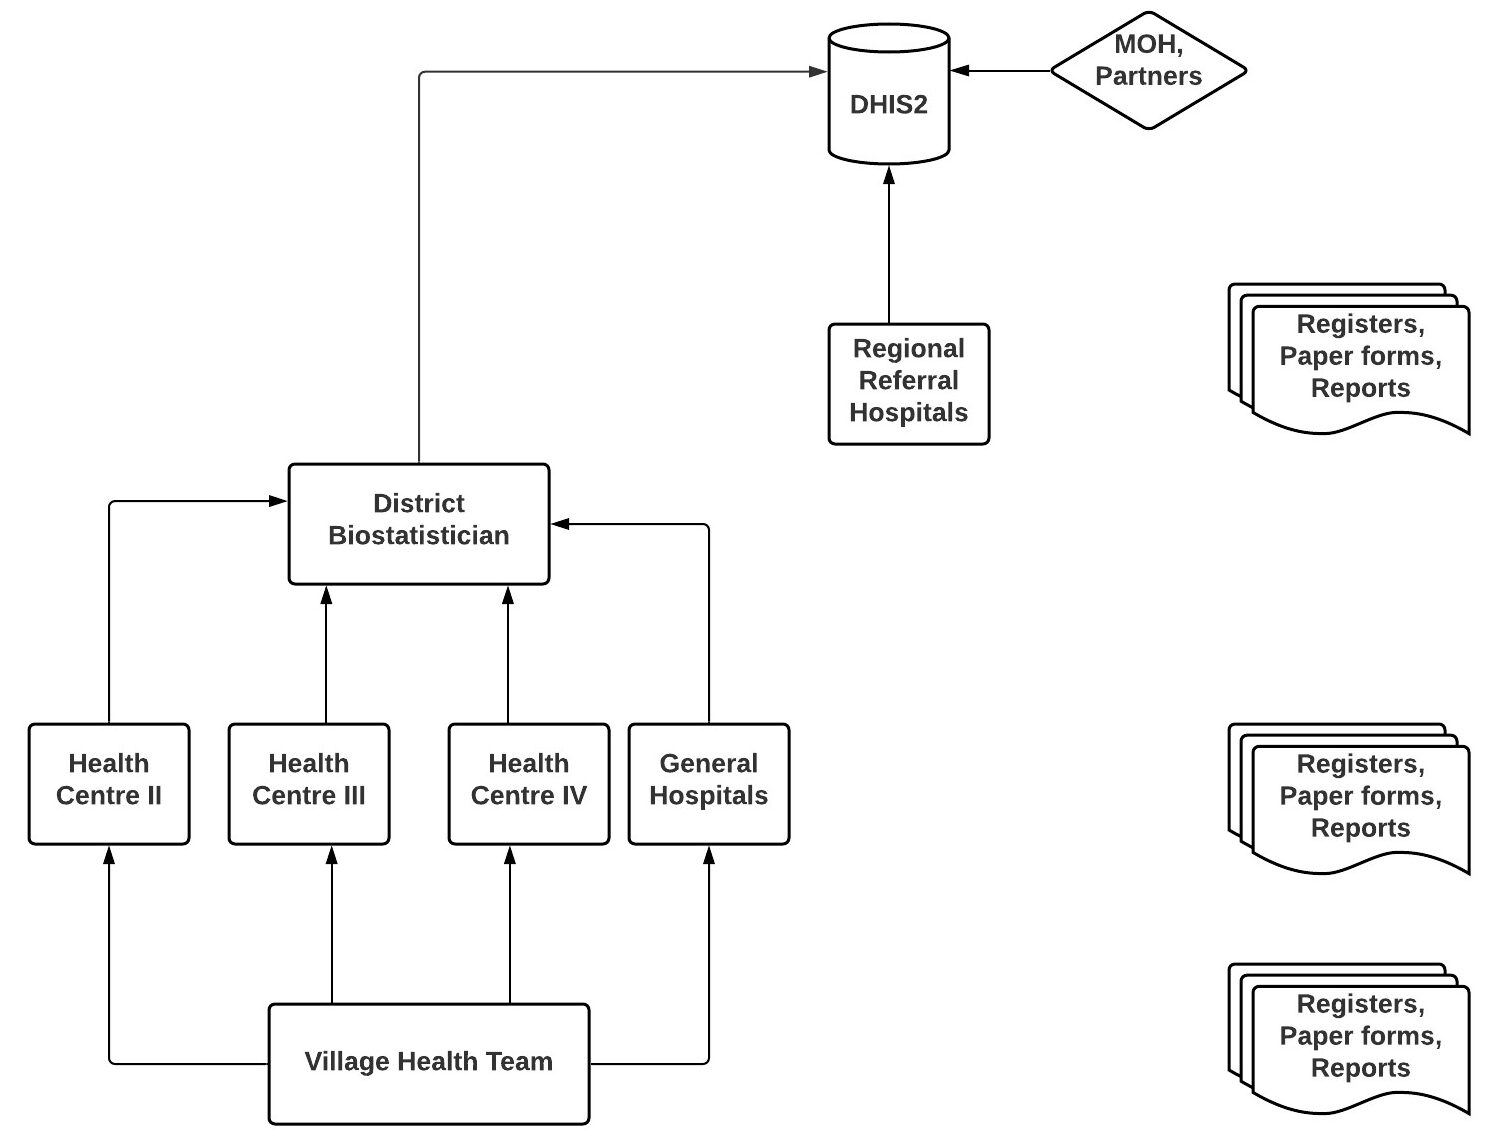
We conducted a descriptive study using routinely collected HMIS data submitted to Ministry of Health electronic database: DHIS2, from 2015 to 2021. It is structured by organisation units with individual health facilities assigned to over 2000 sub–counties and 146 districts in Uganda. Health facilities report monthly data on diseases, commodities, and service delivery through DHIS2. Data are collected through a paper–based system of registers, tally sheets, and monthly data HMIS reporting forms at each health facility. Due to good internet connectivity and availability of infrastructure at RRHs, the collated monthly data are directly entered into the web–based DHIS2 (13). The software captures and remotely stores facility–level data by month and can generate quarterly or yearly reports by different administrative levels (health facility, district, region). The data entered and stored into the system are available to registered users and other stakeholders through a password protected log–in system (Figure 2).
Study variables, data abstraction, and analysis
All–cause mortality data were abstracted from the MOH DHIS2 from 2015 to 2021. In–patient department (IPD) deaths and admissions data are reported on a monthly basis as aggregate numbers using HMIS–108 reporting form. Monthly IPD deaths and admissions data were abstracted for 15 RRHs using the variables total number of deaths and total number of admissions. Reporting rates for the monthly IPD report were also abstracted for the period 2015–2021. Reporting rate refers to the number of reports submitted divided by the number of expected reports. In Uganda, health facilities are expected to submit one IPD report on a monthly basis.
We used logistic regression to model temporal trends in all–cause mortality data from 2015 to 2021 using EpiInfo version 7.2.5.0. We calculated overall death rates as a fraction of IPD admissions per year using data from the 15 RRHs. In this study, death rates were calculated in relation to IPD admissions because these were the patients at risk of dying from healthcare facilities. We used R statistical computing language (15) to visualise average annual deaths, admissions and reporting rates per RRH. We calculated excess deaths in 2020 and 2021 using the five–year historical deaths data (2015–2019) with a Microsoft Excel excess mortality calculator (16) to display lower and upper thresholds for what would be the expected range of deaths over the study period. Excess deaths were calculated by deriving the average of historical deaths data and using the standard error function for confidence intervals.
The confidence interval for the average was calculated using the sample standard deviations. Graphs showing the upper and lower limits of historical deaths, admissions, and death rates/10,000 admissions (95% CI) were drawn. Since number of deaths can be affected by changes in admissions for deaths reported in healthcare facilities, we addressed this by calculating excess deaths for in–hospital deaths per 10,000 admissions. In–hospital 2020 and 2021 death rates per 10,000 admissions were compared to the expected level of deaths using the upper bound of the 95% confidence interval of historical average over the 5–years (2015–2019). Excess deaths (ED) percent is expressed as ED count divided by expected deaths threshold.
We utilized secondary aggregate data reported through Uganda’s Ministry of Health DHIS2. Permission to analyse the data was sought from Ministry of Health through the office of the Director General. The study was exempted from IRB approval since this was non–patient level data routinely collected and aggregated in a central database. The office of the CDC director for science determined that this was a non-research project.
Results
Temporal trends in death rates at regional referral hospitals in Uganda during the COVID–19 pandemic (2020–2021)
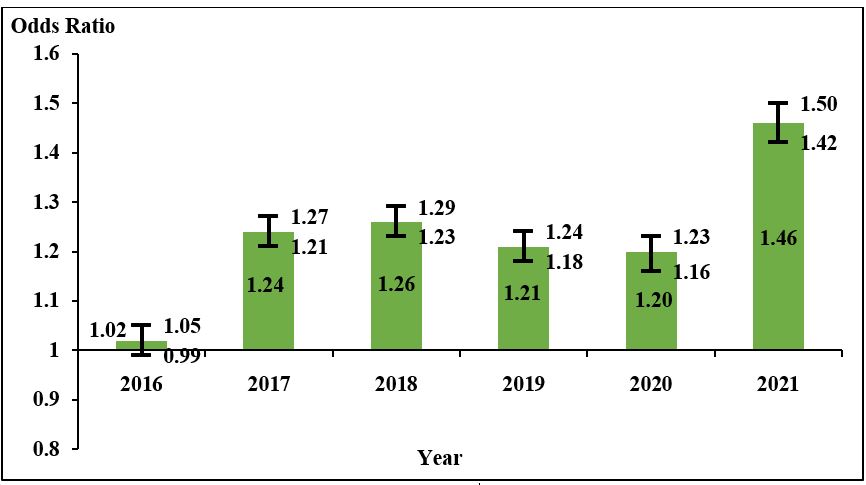
Taking 2015 as the reference year, there was a 2% non–significant increase in death rates at RRHs in 2016 (AOR=1.02, 95%CI = (0.99–1.05), p=0.142) which significantly increased in 2017 (AOR=1.24, 95%CI = (1.21–1.27), p<0.001) and 2018 (AOR=1.26, 95%CI = (1.23–1.29), p<0.001). It then slightly decreased in 2019 (AOR=1.21, 95%CI = (1.18–1.24), p<0.001) and 2020 (AOR=1.20, 95%CI = (1.16–1.23), p<0.001), and increased again in 2021 (AOR=1.46, 95%CI = (1.42–1.50), p<0.001). Overall, there was an increasing trend in death rates at RRHs that more than doubled in 2021 (46%) from levels seen between 2017–2020. This trend was statistically significant from 2017 to 2021 (Figure 3).
Reporting rates for in-patient HMIS form at regional referral hospitals, 2015-2021
With the exception of Entebbe and Fort Portal RRHs, all other 13 hospitals maintained 100% reporting rates during the pandemic period in 2020 and 2021. Overall, reporting rates at RRHs ranged from 93 to 100%.
Excess mortality during the COVID-19 pandemic (2020-2021)
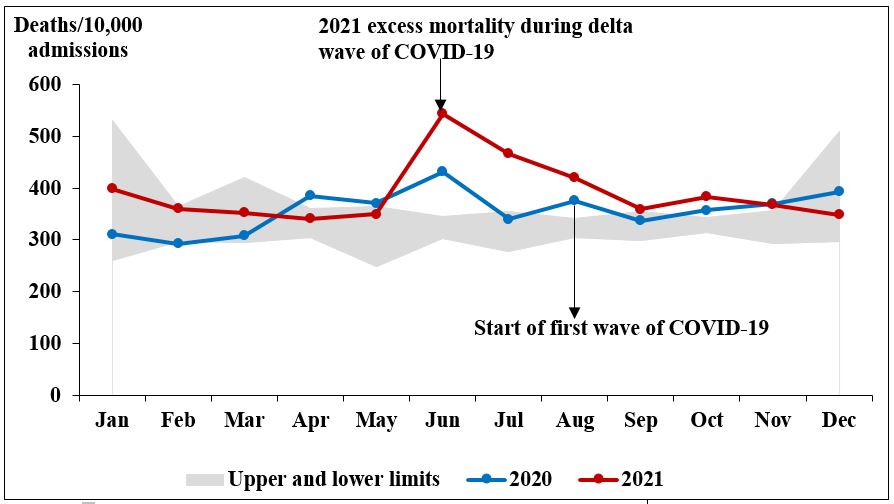
Overall, in 2020, the number of deaths per 10,000 admissions at RRHs exceeded expected levels for six months: April 7% (n=25/360), May 2% (n=6/364), June 25% (n=86/345), August 10% (n=34/341), October 4% (n=15/343) and November 4% (n=13/357). The highest peak in 2020 was observed in June. In 2021, the number of deaths per 10,000 admissions at RRHs exceeded expected levels for six consecutive months: June 57% (n=198/345), July 25% (n=87/355), August 22% (n=75/341), September 1% (n=3/355), October 10% (n=33/343) to November 6% (n=22/357). The month of June had the highest peak in 2021 (57%) which is more than double that observed in 2020 (25%) for the same month (Figure 4).
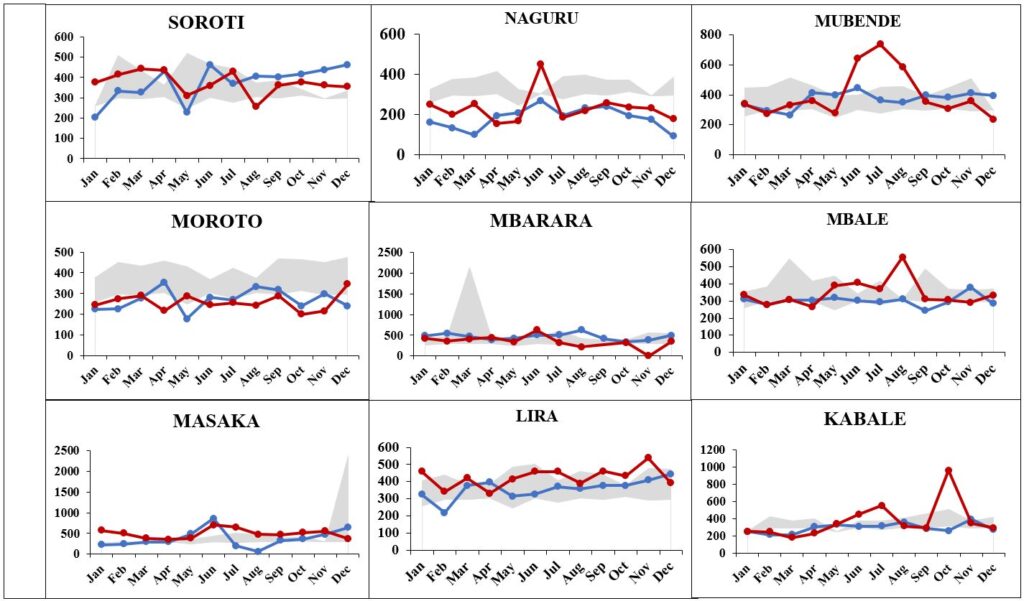
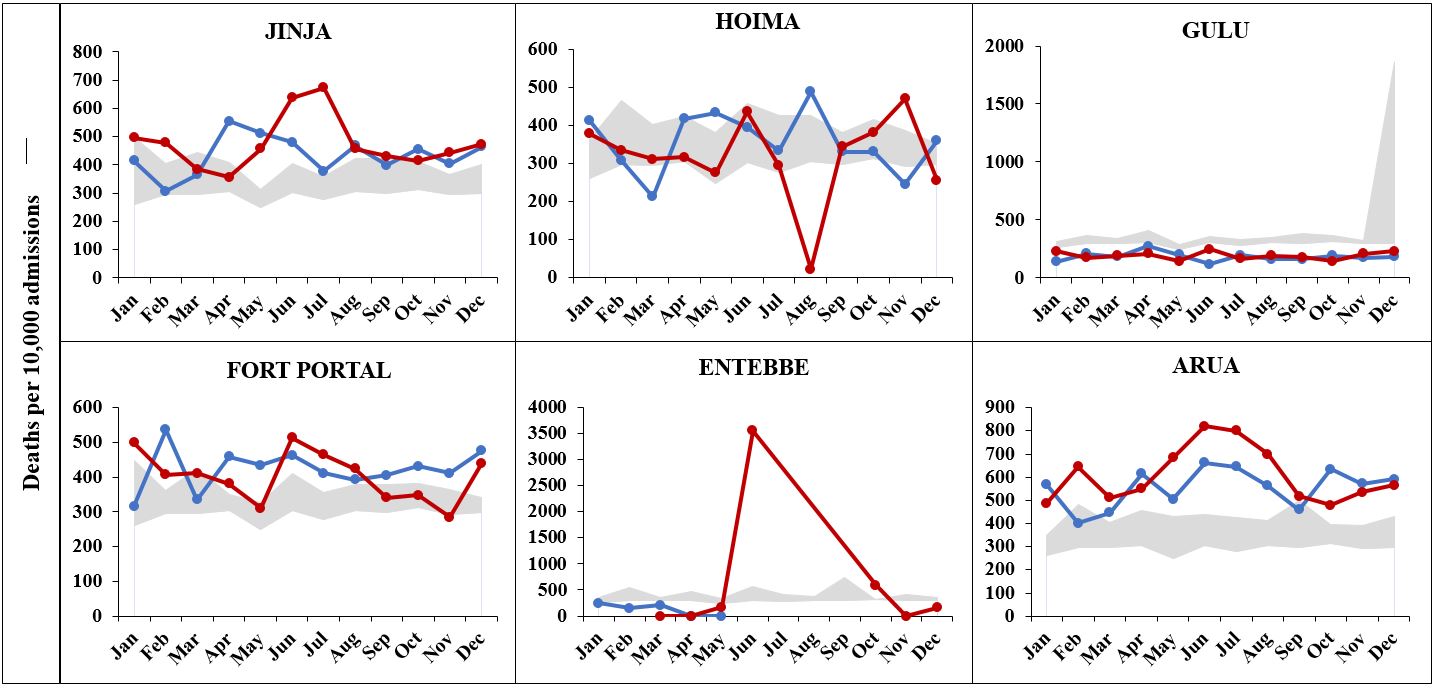
Excess mortality at regional referral hospitals in Uganda during the COVID–19 pandemic (2020–2021)
Out of 15 hospitals, death rates exceeded expected levels at 13 (86%) hospitals in 2021 and 11 (73%) hospitals in 2020 compared to pre–pandemic levels (Figure 5a & 5b).
Discussion
We described temporal trends in all-cause mortality and established the magnitude of excess deaths at RRHs during two years of the COVID–19 pandemic to help quantify its burden in Uganda. We found an increasing trend in mortality rates at regional referral hospitals and observed excess mortality during the pandemic period, 2020-2021.
A significantly increasing trend in death rates at RRHs from 2016 to 2021 was identified, implying that even before the pandemic, death rates at RRHs increased but remained steady until 2020 when the pandemic hit. The low rate observed in 2020 may be explained by the low utilisation of health services during the pandemic as evidenced by Uganda’s first wave (4, 17) which has been attributed to stringent lockdown measures.
The double increase observed in 2021 may be explained by the huge drop in the number of admissions at RRHs. Other studies have shown low healthcare utilisation when pandemic control measures were instituted that may have largely been facilitated by mobility restrictions (3, 4, 18). Even though admissions and deaths relatively declined, the mortality rate greatly increased in 2021.
This probably points to a stronger disruption in healthcare services as staff had to be reassigned to CTUs which may have caused delays in providing services to patients admitted in other wards at RRHs (4). MOH should continue to prioritise prompt funding for surge capacity at healthcare facilities to enable health systems manage shocks like those caused by the COVID–19 pandemic.
We found that the number of deaths in 2021 were higher than those in 2020 in the first half of the year taking on an almost similar trend for the last half of the year where they remained below the monthly expected number of deaths in both years. The number of deaths at RRHs fell below expected levels in April and May 2020 which coincides with the period of the first lockdown measures (1).
In 2021, the number of deaths at RRHs steadily increased from January to May remaining within expected levels until they exceeded the threshold in June. The second total lockdown measures were instituted on 17 June 2021 (1) which might explain the subsequent drop in number of deaths to within expected levels that was observed for the remainder of the year.
There was a huge drop in IPD admissions in April 2020 and June 2021 which coincide with the first and second lockdowns (1) that caused huge disruptions in movement. Overall, admissions were lower than expected during the two years of the pandemic, more so in 2021. Many people stayed away from healthcare facilities due to lack of transport as well as other factors such as perceived risk of COIVD–19 (4). Even with increase in ambulatory services as mandated by MOH, restrictions on movement had the unintended consequence of reducing access to specialised medical services provided at RRHs. In future, MOH should advise government to institute less mobility restrictive measures so that patients can continue having access to healthcare facilities.
Death rates at RRHs exceeded expected levels for six months in both 2020 (non–consecutive) and 2021 (consecutively). The month of June had the highest peak in both years. However, the peak in 2021 was more than double that observed in 2020 for the same month. This finding points to the first and second waves of the pandemic in Uganda which peaked in August–September 2020 and June 2021 (17).
During the first wave of the pandemic, Uganda had registered only thousands in cases of COVID–19 and few deaths. Most cases were among truck drivers and community transmission was still low. The excess death rate may be explained by the disruption in service utilisation where the number of deaths did not match the decline in admissions. These findings are supported by a study which found that patients were reluctant seeking care due to mobility restrictions and fear of getting COVID–19 from health facilities (4).
The excess deaths observed in this study provide evidence of the gravity of the COVID–19 pandemic in Uganda through its direct and indirect impacts on mortality. Although stringent pandemic control measures reduced the transmission of COVID–19, MOH should be cognisant of strong measures that do not avert preventable deaths. For instance, the guidelines for the continuity of essential health services (19) should be quickly implemented in case of such a contagious outbreak in future.
Study limitations
We utilized secondary data aggregated on paper reporting forms before being entered into DHIS2, one drawback could be human errors made during tallying of data from health facility registers or during data entry. Similarly, within DHIS2, currently the only dimension of data quality we can utilise is reporting rates. However, this does not directly point to completeness of reporting. Some of the RRHs did not submit reports for some of the months and we cannot with certainty attribute blanks to zero reporting which would be more informative. Lastly, it is possible that patients might have had repeated hospitalizations.
Conclusion
There was an increasing trend in all-cause mortality at RRHs from 2016 to 2021. Compared to historical data, RRHs recorded excess mortality for six months in both 2020 and 2021. Expanding mortality surveillance to use excess mortality as an indicator can help MOH monitor the mortality burden during epidemics to guide targeted control measures that avert preventable deaths.
Conflict of interest
The authors declare that they had no conflict of interest.
Acknowledgments
The authors would like to thank the medical records personnel of Arua, Gulu, Lira, Soroti, Moroto, Mbale, Jinja, Naguru, Entebbe, Mubende, Fort Portal, Masaka, Mbarara, Kabale, and Hoima Regional Referral Hospitals for timely submission of HMIS data to DHIS2.
Copyright and licensing
All materials in the Uganda National Institute of Public Health Quarterly Epidemiological Bulletin is in the public domain and may be used and reprinted without permission; citation as to source; however, is appreciated. Any article can be reprinted or published. If cited as a reprint, it should be referenced in the original form
References
-
Ministry of Health. Timeline COVID-19 response Info hub: Ministry of Health 2020
[cited 2022 28/02/2022]. Available from: https://covid19.gou.go.ug/timeline.html.
-
Uganda Radio Network (URN). Parliament makes U-turn, praises Museveni in COVID fight:
The Observer,; 2020 [30/03/2022]. Available from: https://observer.ug/news/headlines/64
749-parliament-makes-u-turn-praises-museveni-in-covid-fight.
-
Tumwesigye NM, Denis O, Kaakyo M, Biribawa C. Effects of the COVID-19 pandemic on health
services and mitigation measures in Uganda: Center for Global Development Washington; 2021.
-
Steven NK, Suzanne NK, Fred M, Rawlance N, Susan K, Rhoda KW. Essential Health Services:
Uganda: Exemplars in Global Health; 2022 [05/04/2022]. Available from: https://www.exemplars
.health/emerging-topics/epidemic-preparedness-and-response/essential-health-services/uganda.
-
World Health Organisation. COVID‑19 Strategic Preparedness and Response (SPRP):Monitoring
and Evaluation Framework Geneva: WHO; 2020 [Available from: https://www.who.int/docs/default-
source/coronaviruse/who-ncov-me-framework-web.pdf?sfvrsn=656e430f_1&download=true.
-
Colombo S, Scuccato R, Fadda A, Cumbi AJ. COVID-19 in Africa: the little we know and the lot
we ignore. Epidemiologia e Prevenzione. 2020;44(5-6 Suppl 2):408-22.
-
Alice N, Suzanne NK, Fred M, Rawlance N, Susan K, Rhoda KW. Testing & Surveillance: Uganda:
Exemplars in Global Health 2022 [27/04/2022]. Available from: https://www.exemplars.health/
emerging-topics/epidemic-preparedness-and-response/testing-and-surveillance/uganda.
-
World Health Organisation. The true death toll of COVID-19: estimating global excess mortality
: WHO; 2022 [Available from: https://www.who.int/data/stories/the-true-death-toll-of-covid-19
-estimating-global-excess-mortality.
-
World Health Organisation. Risk of COVID-19 surge threatens Africa’s health facilities 2021
[Available from: https://www.afro.who.int/news/risk-covid-19-surge-threatens-africas-health-f
acilities.
-
Eurostat. Glossary:Excess mortality - Statistics Explained 2020 [Available from: https://ec.e
uropa.eu/eurostat/statistics-explained/index.php?title=Glossary:Excess_mortality.
-
World Health Organisation. Assessment of health facility data quality: Data quality report
card – Uganda, 2010–2011. WHO, Department of Health Statistics and Information Systems (HSI)
WHO Geneva, Resource Centre and Quality Assurance Department of the Uganda Ministry of Health,
Uganda WHO country office; 2011 December 2011.
-
UiO:University of Oslo. DHIS2 Software Overview: University of Oslo; 2022 [28/03/2022].
Available from: https://dhis2.org/overview/.
-
Kiberu VM, Matovu JK, Makumbi F, Kyozira C, Mukooyo E, Wanyenze RK. Strengthening district-
based health reporting through the district health management information software system:
the Ugandan experience. BMC medical informatics and decision making. 2014;14(1):1-9.
-
Ministry of Health. Uganda Hospital and Health Centre IV Census Survey 2014 2014 [15/07/2021].
Available from: http://library.health.go.ug/publications/health-infrastructure/uganda-hospita
l-and-health-centre-iv-census-survey.
-
R Core Team (2022). R: A Language and Environment for Statistical Computing. R Foundation for
Statistical Computing, Vienna, Austria https://www.R-project.org
-
Vital Strategies. Excess mortality calculator for monthly analysis. : NY: Vital Strategies;
2020 [Available from: https://preventepidemics.org/covid19/resources/excess-mortality/.
-
Johns Hopkins University & Medicine. Coronavirus Resource Center: Johns Hopkins University &
Medicine; 2022 [28/04/2022]. Available from: https://coronavirus.jhu.edu/region/uganda.
-
Burt JF, Ouma J, Lubyayi L, Amone A, Aol L, Sekikubo M, et al. Indirect effects of COVID-19
on maternal, neonatal, child, sexual and reproductive health services in Kampala, Uganda. BMJ
global health. 2021;6(8):e006102.
-
Ministry of Health (MOH). Guidance on Continuity of Essential Health Services during the
COVID-19 outbreak Kampala: MOH; 2020 [Available from: https://tciurbanhealth.org/wp-content
/uploads/2020/05/MOH-GUIDANCE-ON-BUSINESS-CONTINUITY-000.docx3_.pdf
Comments are closed.