
Increasing stock-outs of critical malaria commodities in public health facilities in Uganda, 2017-2022
Authors: Jane Frances Zalwango1*, Marie Gorreti Zalwango1, Helen Nelly Naiga1, Rebecca Akunzirwe1, Ronald Kimuli2, Claire Biribawa, Lilian Bulage1, Daniel Kadobera1, Richard Migisha1, Alex Riolexus Ario1 Institutional affiliations:1Uganda Public Health Fellowship Program-Uganda National Institute of Public Health, Kampala, Uganda, 2National Malaria Control Division, Ministry of Health, Kampala, Uganda; Correspondence*: Tel: +256-779199389, Email: jzalwango@musph.ac.ug
Summary
Background: Consistent access to malaria treatment commodities at health facilities is necessary to address malaria morbidity and mortality. In Uganda, there needs to be documentation of the trends of stockouts of these commodities. We described the trends and spatial distribution of stockouts of malaria diagnostic and treatment commodities in Uganda, 2017-2022.
Methods: We analyzed monthly artemisinin combination therapy (ACT) and rapid diagnostic test (RDT) stock data from the District Health Information System (DHIS2) for public facilities at the general hospital level and below during 2017-2022. A facility was considered stocked out in a month if it reported ≥1 day of stockout of a commodity during that month. We calculated the proportion of facilities stocked out of ACT and RDTs per month and evaluated ACT stockouts by health facility type. We used the seasonal Mann-Kendall test and Sen’s slope estimator to evaluate trends. Districts were considered stocked out for a commodity in a year if the average monthly health facility stockout proportions were >10% in that year.
Results: Among an average of 2,210 facilities reporting per month (range, 1,341- 2,791), most (56%) were Health Centre IIs. There were seasonal peaks in stockouts of ACTs and RDTs, with small peaks in December through February and sharp peaks in June through September. At the national level, we observed a significant increase in the monthly ACT (S’=474, p<0.001; Sen’s slope=+0.59) and RDT (S’=444, p<0.001; Sen’s slope=+0.616) stockouts over the study period. Monthly ACT stockouts increased significantly across all facility levels, with Health Centre IIs having the largest increase (S’=472, p<0.001; Sen’s slope=+0.697) while general hospitals reported the smallest increase (S’=198, p=0.026; Sen’s slope=+0.201). Among 136 districts, the number of districts experiencing ACT stockouts increased steadily, from 5 in 2017 to 85 in 2022.
Conclusion: Malaria diagnosis and treatment commodity stockouts increased from 2017-2022 across Uganda. Reasons for this increasing trend should be explored and addressed to improve access to essential malaria treatment commodities.
Background
Uganda has made tremendous progress in malaria control in recent years, with significant reductions in morbidity and mortality over the last decade, malaria parasite prevalence dropping from 45% in 2009 to 9% in 2019[1, 2]. Despite these reductions, malaria remains one of the leading causes of morbidity and mortality in Uganda[3], accounting for 5% of all global malaria cases in 2021 and 3.2% of all reported deaths in the same year[4].
The Uganda National Malaria Control Program (NMCP) is charged with providing quality assured services for Malaria prevention and treatment to all people in Uganda. The program aims to reduce malaria morbidity by 50% and malaria-related mortality by 75% by 2025 compared to 2019 levels of 11 million reported cases and 12,000 recorded deaths2019 [5]. To accomplish this, a combination of prevention and treatment interventions are intensively implemented.
These include prompt and effective case management, nationwide distribution of long-lasting insecticide-treated bed nets (LLINs), indoor residual spraying (IRS), seasonal malaria chemoprevention, and intermittent malaria prevention during pregnancy. The presence of a consistent, reliable, and sufficient supply of malaria commodities when and where they are required is critical to achieve malaria control; NMCP aims to have at least 90% of all facilities reporting no stockouts of antimalarial commodities at any given time[5].
Stock-outs, on the other hand, are frequently reported across the country. According to the weekly national malaria bulletins, >10% of all districts have insufficient artemisinin Combination Therapy (ACTs) and rapid diagnostic tests (RDTs) each week to last them until the next resupply, putting them at risk of stock-out. These stock-outs are caused by a number of factors that include; irregular pattern of supply due to complex bureaucratic processes, illegal commodity diversion, inaccurate quantifications, and insufficient financing[6-8]. The stock-outs limit access to effective malaria treatment contributing to inappropriate care, poor adherence to prescribed regimes since the patients have to incur an out-of-pocket expense to buy stocked out medicines, poor healthcare utilization increasing morbidity and, possibly, mortality[8-10].
While stock status was regularly monitored, providing a snapshot of the stock situation, there had been no documentation on the trends of stock-out of vital malaria commodities. This information, on the other hand, was critical for informing the Ministry of Health about progress in improving access to essential commodities and generating innovative ways to manage antimalarial commodity stock. We described the trends and spatial distribution of stockouts of malaria diagnosis and treatment commodities in Uganda, 2017-2022.
Methods
Study design and setting
We conducted a descriptive analysis of national surveillance data for Health facility level reports on stockouts of malaria commodities. As of 2018, Uganda had approximately 6,900 health facilities of which close to half of them were government owned, a third were private not for profit, and the rest were private or community owned. The health system is divided into levels with health facilities designated as health centre level two (HC 2) to health centre level four (HC 4); general hospital, regional referral hospital, and national referral hospital.
The largest proportion of healthy facilities in Uganda are HC 2s[11]. The commodity supply chain at these facilities is divided into two levels: (i) push supply chain strategy at HC 2 and 3, in which commodities are calculated once a year based on various quantification methods like disease morbidity and consumption; constant supply kit sizes customized to these facilities and dispatched every 2 months with no room for adjustment and (ii) pull strategy utilized at HC 4 and general hospitals that offers a quarter basis quantification plan[12, 13]. This analysis involved government owned facilities from general hospitals and below that are non-autonomous in regards to medical commodities acquisition; all with capacity to test and treat malaria.
Study variables, data sources, data abstraction, and analysis
We used malaria commodities surveillance data (ACT and RDTs) obtained from the District Health Information System (DHIS2) for the period of 2017-2022. Artemisinin combination therapy and rapid diagnostic test stockout data are captured on a monthly basis using the Health Management Information System (HMIS) form 105 and entered into DHIS2, a web-based reporting system. These monthly data were extracted and summarized. We specifically abstracted monthly data from HMIS 105 105-SS01b. artemether/lumefantrine-days out of stock and 105-SS11b. malaria rapid diagnostic tests-days out of stock during 2017-2022 for every reporting public health facility from general hospital level and below. We summarized the data in Microsoft excel sheets and exported to Stata V.14 for analysis.
The data was aggregated into health facility level, districts, regions, and national levels. A facility was classified as stocked out in a month if it reported ≥1 day of stockout of a commodity during that month. Analysis of stockout data was done primarily on a monthly basis to check for seasonality given that malaria is a seasonal disease. The proportion of facilities classified as stocked out per month was calculated by dividing the total number of health facilities at that level reporting as stocked out of a malaria commodity per month by the total number of health facilities at that level reporting that month.
The health facility monthly stockout proportions were then averaged over a particular year to calculate the yearly stockout proportions for both RDTs and ACTs for that year at national level. A seasonal Mann- Kendal test for trends Sen’s slope estimator were used to determine the significance of stockout trends. Since ACT and RDT stockout data followed a similar trend, we focused on ACT stockouts for secondary analysis by health facility type and examined it’s spatial distribution by district and region as they are critical for case management. Districts and regions were classified as stocked out for a commodity in a year if the average monthly health facility stockout proportions were >10% in that year with reference to the Malaria Strategic Plan 2021-2025 target of <10% of all facilities in an organization unit reporting stockouts at any one point in time[5]. We drew choropleth maps using QGIS to show this stockout distribution.
Ethical considerations
Our study utilized routinely generated aggregated surveillance data with no personal identifiers in health facility monthly reports, obtained from the DHIS-2. The Uganda Public Health Fellowship Program is part of the National Rapid Response Team, and has been granted permission to access and analyse surveillance data in the DHIS-2 and other data such as survey and field investigation data to inform decision making in the control and prevention of outbreaks and public health programming. Additionally, the MOH has also granted the program permission to disseminate the information through scientific publications. We stored the abstracted data set in a password-protected computer and only shared it with the investigation team. In addition, the Office of the Associate Director for Science, U.S. Centers for Disease Control and Prevention, determined that this study was not a human subjects research with the primary intent of improving use of surveillance data to guide public health planning and practice.
This activity was reviewed by CDC and was conducted consistent with applicable federal law and CDC policy. §
- See e.g., 45 C.F.R. part 46, 21 C.F.R. part 56; 42 U.S.C. §241(d);5 U.S.C. §552a; 44
U.S.C. §3501 et seq.
Results
Trends of artemisinin combination therapy and rapid diagnostic tests stockouts, Uganda, 2017-2022
Between 2017 and 2022, a total of 159,172 reporting public health facilities (from general hospital downwards) were recorded and included in the analysis. Highest number of reporting facilities were observed in 2022 with 2,505 reporting facilities on average every month and the lowest in 2020 with 1,625 reporting facilities each month.
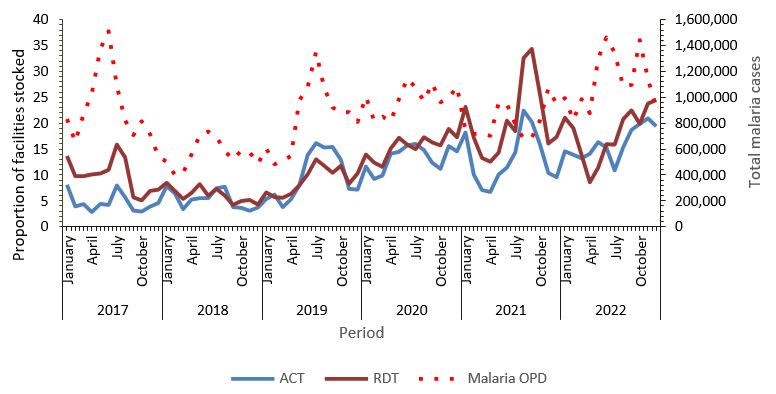
Monthly visualization of the data showed seasonal peaks in the proportion of facilities reporting stockouts of both commodities, with small peaks in December through February and sharp peaks in June through September, with the highest peaks for ACTs and RDTs recorded in August and September 2021, respectively coinciding with the malaria case peaks around mid every year (Figure 1).
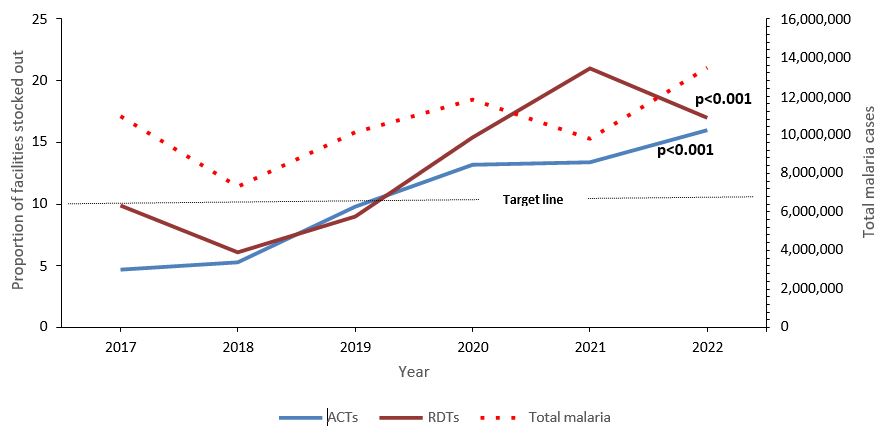
On aggregation into annual data, the proportions of facilities reporting stockouts of ACTs increased steadily over the years peaking in 2022 alongside malaria cases while RDT stockouts peaked in 2021 contrary to the reducing patterns in malaria cases that year (Figure 2). Overall, the proportion of health facilities reporting stockout of both commodities increased significantly over the study period after accounting for seasonality.
Trends of artemisinin combination therapy stockouts by health facility level, Uganda, 2017-2022
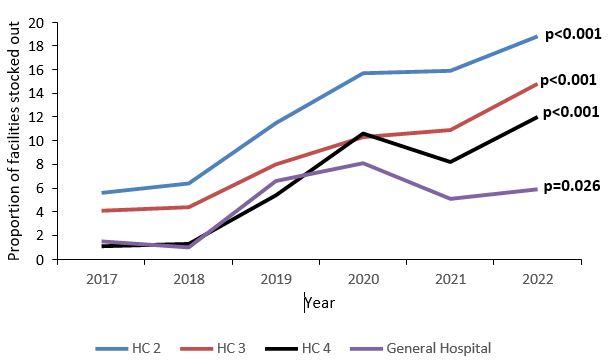
On stratification by health facility level, the majority (56%) of reporting facilities over the study period were health centre 2s. The total of reporting facilities over the six-year period were: i) 88,384 health centre 2s (10,000-17,000 HC 2s reporting each year), ii) 57,198 health centre 3s (7000-11,000 HC 3s each year), iii) 9,765 health centre 4s (1,100-1,800 HC 4s each year), and iv) 2,976 general hospitals (300-500 reporting each year). Overall, the burden of ACT stockouts increased significantly over the six-year study period across all health facility levels. The highest burden and largest increase in ACT stockouts were recorded among health centre 2s (Figure 3).
Spatial distribution of artemisinin combination therapy stockouts, Uganda, 2017- 2022
Distribution of artemisinin combination therapy stockouts by regional level, Uganda, 2017-2022
At regional level, the ACT stockouts were within the target before 2019 when 4 regions reported a burden >10% after which, Busoga and North Central regions consistently recorded >10% of their facilities with stockouts (Figure 4)
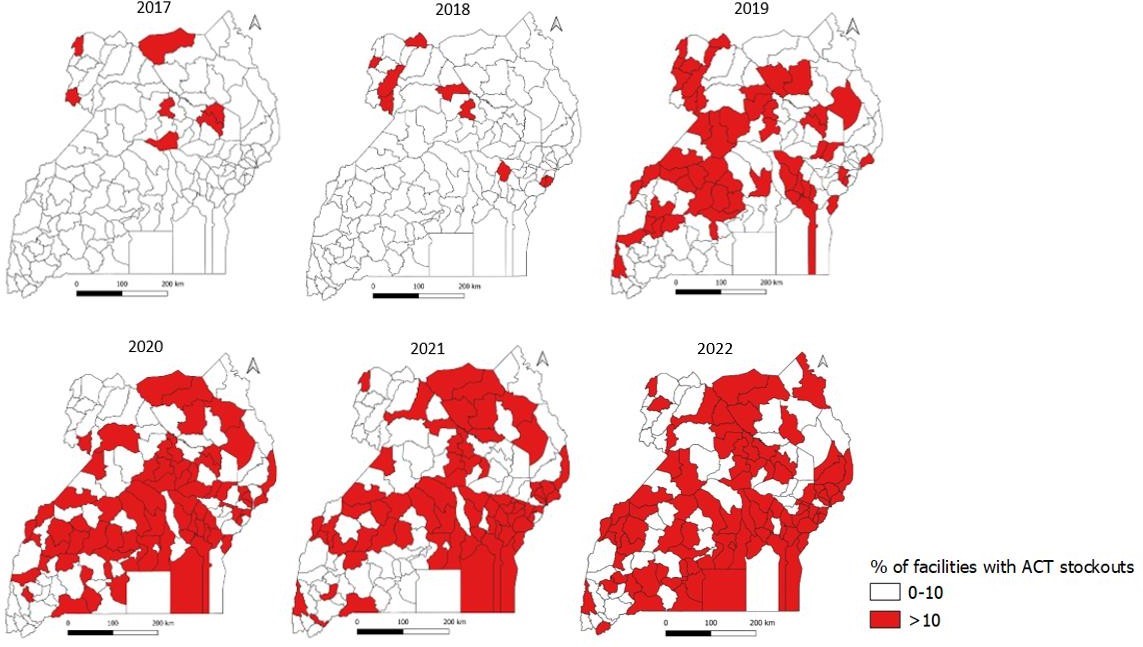
Distribution of artemisinin combination therapy stockouts by district level, Uganda, 2017-2022
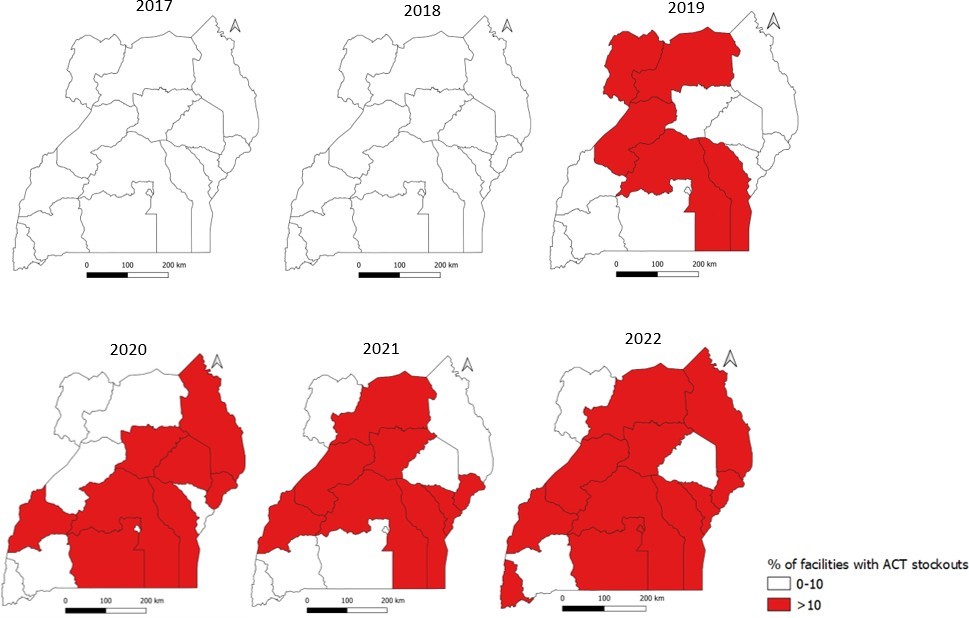
The burden of ACT stock out at district level increased over the years from 5 districts reporting a burden greater than 10% in 2017 to 85 in 2022. Stockouts were reported in the northern and eastern parts of the country in 2017 and 2018 before spreading to all regions in the country in the subsequent years (Figure 5)
Discussion
This descriptive analysis of surveillance data evaluated the stockout of malaria diagnosis and treatment commodities over a period of six years and found that stockouts of malaria commodities was common and increased significantly over the study period. As of 2022, 16 in every 100 facilities reported stock out of ACTs and 18 in 100 facilities experienced stockout of RDTs. This is much higher than the Malaria Strategic Plan 2021-2025 target of <10% of all facilities reporting stockouts of malaria commodities at any one time. ACT stockouts burden was highest among HC 2s translating into a higher burden for facilities under the push supply chain strategy.
Among 136 districts, the number of districts experiencing ACT stockouts increased steadily, from 5 in 2017 to 85 in 2022. Given that malaria case management (diagnosis and effective treatment) is a key element in malaria control, these findings highlight the need to improve malaria commodity supply and availability at all facilities if we are to meet the country’s targets of reducing malaria morbidity and mortality.
Stockouts of all medicines are common in Uganda due to various systemic factors like poor planning, prioritization and forecasting of required medicines at facilities, ineffective supervision, polypharmacy tendencies, inadequate data management and monitoring systems that are compounded by distribution barriers[14, 15]. Distribution of medicines to public health facilities in Uganda is mandated to the National Medical Stores (NMS) that has a 2-month cycle plan for distribution. However, challenges are faced along this distribution cycle with facilities missing 2-3 cycles of supply due to delays in release of distribution funds as highlighted by the NMS spokesperson during a phone interview in February 2023 “…the delays in the distribution of medicines … have largely been as a result of lack of timely payment of funds for distribution” [16].
These distribution barriers are similar as faced in other low and middle-income countries as highlighted as the most cited reason for stockouts in a systematic review evaluating stockouts of essential medicines among community health workers [8]. Aside from distribution delays, the supply chain faces other major issues such as commodity theft within facilities, which could contribute to rampant stockouts as reported in a 2023 study evaluating organized theft of medicines in the EU and beyond[17] Similarly, theft of medicines has severally been recorded in Uganda with most recent occurrence reported in one of the government health facilities in which a health worker was arrested while in possession of government drugs, including malaria test kits (RDTs)[18]. This could explain the noticed discrepancies in peaking of RDT stockouts while malaria cases went down.
From this analysis, stockouts of malaria diagnosis and treatment commodities increased over the years. However, these increases were not uniform with noticeable sharp increases between 2018-2019 and 2019-2021. Between 2018 and 2019, we notice a 4.5 and 2.9 absolute difference in proportion of facilities reporting stock out of ACTs and RDTs respectively. This could be explained by the increased diagnosis and treatment needs following the observed sharp rise in diagnosed malaria cases in 2019 as reported in other Ugandan studies [19, 20]. These studies attributed these increases to changes in the existing malaria control measures at the time: i) waning off of IRS effects in some districts where the intervention had been discontinued in 2017 leading to 5-fold increase in malaria incidence relative to the baseline within 10 months of stopping IRS and ii) ageing of mosquito nets distributed in 2017/2018 [19, 20].
Mosquito net wear and tear is thought to start within one year of net distribution contributing to the increase in malaria cases in 2019; a year after the mass mosquito net campaign. A study conducted in western Uganda reported 33.7% of distributed nets having holes a year after distribution and 77.4% after 36-42 months of use[21]. It is therefore, no surprise that malaria diagnosis and treatment commodities followed a similar trend that year; increased case numbers translates into increased testing and treatment needs which might be higher than the projected needs of the country at the time since retrospective data is utilized in projecting commodity needs[13].
Between 2019 and 2021, another sharp rise in stockouts of ACTs and RDTs was recorded. In 2020, Uganda reported her first COVID-19 patient and declared an epidemic of the disease[22]. Due to the unspecificity of COVID-19 causing symptoms similar to malaria; fever, headache, joint pains[23], and Uganda being endemic for malaria, we would expect malaria suspicion to be high and contribute to the overconsumption of RDTs and ACTs leading to frequent stockouts as observed in this study. However, a study by Namuganga et al reported a reduced consumption of RDTs during the pandemic contrary to our findings[24]. This could be due to their study being conducted in a small part of the country compared to our national analysis.
Beyond diagnosis, the instigated COVID-19 control measures disrupted the supply chain system globally that affected delivery schedules with facilities experiencing longer lead times attributed to reduced movement of goods and limited ability to manufacture[25, 26]. In Uganda, these measures were reported to have totally disrupted the supply chain system and health care services delivery with personnel and resources being diverted away from priority diseases like malaria[27]. This could have contributed greatly to the noticed increases in stockouts in both commodities.
For malaria prevention and control to be effective, we need to effectively treat all cases and stop transmission. Without the treatment commodities, there is persistent parasitemia in the communities with opportunities for transmission[4]. For this paper, we looked deeper into the stockouts of ACTs on lower levels to further understand the problem. The regional and district trends of stockout of ACTs followed a similar trend as the national picture.
The number of regions and districts reporting proportions of stocked out facilities greater than 10% increased over the study period. This increase also started to rise in 2019 following the increase in malaria case numbers with highly stocked out regions corresponding to those reporting upsurges in the same year and are known high risk regions: Acholi, Busoga, Bunyoro, North Central, and West Nile[28].
Regardless of no regions reporting stock out greater than 10% in 2017 and 2018, deeper analysis revealed districts within the regions with proportions of stocked out facilities as high as 16% and 31% in those respective years. This highlights the need of conducting lowest unit level analysis in order to understand the problem at hand and instigate appropriate control measure as the aggregated data at higher levels could potentially mask the true extent of the problem.
At facility level, stockouts of ACTs increased at all levels with the largest increase among HC 2s followed by HC 3s. This is contrary to findings from a Ugandan study that found lower stockouts of essential medicines and health supplies among HC 2s compared to higher level facilities[29]. These differences in findings can be explained by the bigger sample size in our study and analysis being done over a longer period of time. In Uganda, majority of the reporting health facilities are at the HC 2 level with the ability to test and treat uncomplicated malaria beyond which a formal referral system is utilized.
Following this cascade, since majority of malaria cases are uncomplicated, they are managed at the HC 2 and 3 levels[11]. These two levels are under the push supply chain strategy in which commodities are calculated once a year based on various quantification methods like disease morbidity and consumption[12, 13]. During this quantification process, constant population projections are factored in that might not cater for unforeseen seasonal population changes like refugee migrations and urbanization that could contribute to increased unanticipated stock utilization[30, 31].
Beyond the strategy utilized, the supply chain system in Uganda faces numerous human resource challenges with 10-55% of supply chain positions remaining vacant at all levels of care[32]. The same study reported that lower level facilities experienced more understaffing with a higher turnover of supply chain staff. With limited staffing and no specialized personnel to manage stocks and conduct stock quantification based on the changing disease dynamics, facilities would not be able to adequately quantify their commodity needs. This could explain why we observed higher levels of stockouts among HC 2s compared to other levels.
Study limitations
This study utilized secondary data from DHIS2 a platform mandating monthly reporting from all facilities. However, the analysis revealed a disparity in monthly reporting compliance, signifying an 880-facility variance between periods characterized by the most and least prolific reporting. This might have led to an underestimate of the level of stock out of malaria commodities.
Conclusion
Malaria diagnosis and treatment commodities stockouts increased over the study period across Uganda. The noticed changes could be attributed to changes in malaria control interventions in the country in 2019 and interruptions in health care services due to COVID-19 starting 2020. Stockouts of ACTs increased across all facility levels, regions and districts. Reasons for the observed increasing trend should be explored and addressed to improve access to essential malaria treatment commodities. We recommend conducting a follow-up study to understand the consumer response to stockouts; this might help explain late health seeking behaviours, self-medication practices, and malaria related mortality.
Conflict of interest
The authors declare that they had no conflict of interest.
Authors’ Contributions
JFZ, MGZ, HNN, and RA: Participated in the conception, design, analysis, interpretation of the study and wrote the draft bulletin; RK, RM, and CB reviewed the report, reviewed the drafts of the bulletin for intellectual content and made multiple edits to the draft bulletin; LB, DK, and ARA reviewed the manuscript to ensure intellectual content and scientific integrity.
Acknowledgements
The authors thank the staff of the Public Health Fellowship Program for the technical support and guidance offered during this study. The authors also extend their appreciation to the Ministry of Health Malaria Control Division for their support in conducting the study.
Copyright and licensing
All material in the Uganda Public Health Bulletin is in the public domain and may be used and reprinted without permission. However, citation as to source is appreciated. Any article can be reprinted or published. If cited as a reprint, it should be referenced in the original form.
References
- Uganda Ministry of Health, Uganda Malaria Indicator Survey 2018-19.
- Uganda Bureau of Statistics (UBOS) and ICF International, Uganda Malaria Indicator Survey (MIS) 2018-2019. 2020: Kampala,Uganda and Rockville, Maryland, p. .
- Uganda Ministry of Health, Annual Health Sector Performance Report Financial Year 2020/21. 2021, Ministry of Health:
- WHO, World malaria report.
- Uganda Ministry of Health, THE UGANDA MALARIA REDUCTION AND ELIMINATION STRATEGIC PLAN 2021-2025. 2020.
- Oluka, P.N., F. Ssennoga, and S. Kambaza. Tackling supply chain bottlenecks of essential drugs: a case of Uganda local government health units. in 4th International Procurement Conference.
- Kalangwa, , Why stockout and expiration of medicines occur: the case of Uganda. 2022.
- Olaniran, A., et al., Stock-outs of essential medicines among community health workers (CHWs) in low-and middle-income countries (LMICs): a systematic literature review of the extent, reasons, and consequences. Human resources for health, 20(1): p. 1-10.
- Kuwawenaruwa, A., et al., The effects of medicines availability and stock-outs on household’s utilization of healthcare services in Dodoma region, Tanzania. Health policy and planning, 2020. 35(3): 323-333.
- Zalwango, J.F., et al., Malaria diagnostic and treatment practices for febrile children under 5 years at two general hospitals in Karamoja, a high transmission setting in Uganda. Malaria Journal, 2022. 21(1): p. 1-9.
- Uganda Ministry of Health, National health facility master list 2018.
- Bukenya Denis Joseph, Understanding the Systems that Influence Distribution Channels for Drugs in Uganda. 2018. p. http://www.peah.it/2018/01/understanding-the-systems-that-influence- distribution-channels-for-drugs-in-uganda/.
- Management Sciences for Health, Quantifying pharmaceutical requirements. p. https://msh.org/wp-content/uploads/2013/04/mds3-ch20-quantifying- mar2012.pdf.
- Ministry of Finance, P.a.E.D., Continuous stock-outs of medical supplies in Uganda: What are the root causes?, M.a.A.U. (BMAU), Editor. 2015: Kampala.
- Lugada, E., et al., Health supply chain system in Uganda: current issues, structure, performance, and implications for systems strengthening. Journal of pharmaceutical policy and practice, 15(1): p. 14.
- Nagitta, D., NMS blames drug stock-outs on financial bottlenecks, in Daily Monitor. 2023, Daily Monitor.
- Dugato, M. and C. Sidoti, The Organised Theft of Medicines: a Study of the Methods for Stealing and Reselling Medicines and Medical Devices in the EU and European Journal on Criminal Policy and Research, 2023: p. 1-22.
- Okaba, , Nebbi pharmacist survives lynching after being caught with stolen drugs, in Daily Monitor. 2023, Daily Monitor: epaper.
- Namuganga, J.F., et al., The impact of stopping and starting indoor residual spraying on malaria burden in Uganda. Nature communications, 2021. 12(1): p. 1-9.
- Nabatanzi, , et al., Malaria outbreak facilitated by increased mosquito breeding sites near houses and cessation of indoor residual spraying, Kole district, Uganda, January-June 2019. BMC Public Health, 2022. 22(1): p. 1-9.
- Kilian, A., et al., Evidence for a useful life of more than three years for a polyester-based long-lasting insecticidal mosquito net in Western Uganda. Malaria journal, 10(1): p. 1-13.
- Uganda Ministry of Health, Coronavirus Disease (COVID-19) Case Confirmed. 2020:
- Hussein, M.I.H., et al., Malaria and COVID-19: unmasking their ties. Malaria journal, 19(1): p. 1-10.
- Namuganga, J.F., et al., Impact of COVID-19 on routine malaria indicators in Uganda: An interrupted time series Research Square, 2021.
- Jifar, W.W., G.B. Geneti, and S.D. Dinssa, The Impact of COVID-19 on Pharmaceutical Shortages and Supply Disruptions for Non-Communicable Diseases Among Public Hospitals of South West, Oromia, Ethiopia. Journal of Multidisciplinary Healthcare, 15: p. 1933-1943.
- Tirivangani, , et al., Impact of COVID-19 pandemic on pharmaceutical systems and supply chain–a phenomenological study. Exploratory Research in clinical and social pharmacy, 2021. 2: p. 100037.
- Relief web, Easing COVID-19 impact on key health services, Uganda. 2020. p. https://reliefweb.int/report/uganda/easing-covid-19-impact-key-health-services.
- Outbreak News Today, Uganda reports malaria upsurge: 40 percent increase. 2019: Online. p. http://outbreaknewstoday.com/uganda-reports-malaria-upsurge- 40-percent-increase-31674/.
- Lugada, E., et al., Health supply chain system in Uganda: assessment of status and of performance of health facilities. Journal of Pharmaceutical Policy and Practice, 15(1): p. 58.
- OIM, Migration in Uganda–A rapid country profile 2015.
- Amazing charts, How Does Improved Health Care Affect Population Growth? 2022.
- Lugada, E., et al., Health supply chain system in Uganda: current issues, structure, performance, and implications for systems strengthening. Journal of Pharmaceutical Policy and Practice, 15(1): p. 1-11.
Comments are closed.